| Issue |
Eur. Phys. J. Appl. Phys.
Volume 97, 2022
Special Issue on ‘Nanoalloys: Kinetic and Environmental Behaviour’, edited by Pascal Andreazza, Riccardo Ferrando and Liu Xiaoxuan
|
|
|---|---|---|
| Article Number | 59 | |
| Number of page(s) | 11 | |
| Section | Nanomaterials and Nanotechnologies | |
| DOI | https://doi.org/10.1051/epjap/2022210298 | |
| Published online | 08 September 2022 | |
https://doi.org/10.1051/epjap/2022210298
Regular Article
Structural and optical properties of silver-indium and silver-aluminium nanoalloys: stability against oxidation★
1
Univ. Lyon, Université Claude Bernard Lyon 1, CNRS, Institut Lumière Matière, UMR 5306, 69622 Villeurbanne, France
2
Univ. Lyon, INSA Lyon, UCBL, CNRS, MATEIS, UMR5510, 69621 Villeurbanne, France
* e-mail: This email address is being protected from spambots. You need JavaScript enabled to view it.
Received:
20
December
2021
Received in final form:
29
March
2022
Accepted:
31
March
2022
Published online: 8 September 2022
Abstract
Bimetallic nanoparticles (BNPs) are promising candidates for fundamental research and applications, as their physico-chemical properties can, in many cases, be tuned continuously, or enhanced with respect to the mono-metallic particles. Here we investigate the possibility of fabricating silver-indium and silver-aluminium BNPs in the range of 4–5 nm diameter and of varying stoichiometry by laser vaporization and gas condensation in the gas phase. We analyse their crystalline structure and segregation behaviour using transmission electron microscopy and probe their oxidation state in optical absorption measurements by tracking spectral changes of the localized surface plasmon resonance (LSPR). These complementary techniques show that, despite the small size and the high reactivity especially of aluminium, the BNPs form a silver-rich alloyed core surrounded by an oxide shell. Exposure to air leads to consecutive oxidation, whereas annealing the BNPs in a reducing atmosphere stabilizes the alloyed particle cores, as demonstrated by a narrow and blue-shifted LSPR. This is a first step towards the stabilization of non-oxidized bimetallic nanoparticles combining a noble and a trivalent metal.
Supplementary material is available in electronic form at https://www.epjap.org/10.1051/epjap/2022210298
© É. Camus et al., Published by EDP Sciences, 2022
 This is an Open Access article distributed under the terms of the Creative Commons Attribution License (https://creativecommons.org/licenses/by/4.0), which permits unrestricted use, distribution, and reproduction in any medium, provided the original work is properly cited.
1 Introduction
Mixing two metals at the nanoscale is an original way to elaborate new nanomaterials with singular properties and potential applications in various fields (catalysis, magnetism, optics, sensing…). Such systems, called nanoalloys or bimetallic nanoparticles (BNPs), have been the subject of much research over the last two decades [1–3]. Their properties depend intimately on their size, shape, composition and on their chemical structure, ranging from solid solution with or without chemical ordering to segregated phases such as core@shell or “Janus”-type structures. In this regard, some interesting properties of mono-metallic nanoparticles (NPs) made of rare elements can be recovered or even enhanced by appropriate alloying with more abundant and cheaper alternative metals [4]. There is thus a great technological and commercial advantage to switch from mono- to bimetallic systems.
In the field of optics, BNPs of particular interest are those containing at least one element whose optical absorption spectrum in its pure NP form is known to develop a well-defined localized surface plasmon resonance (LSPR) [5,6]. Indeed this LSPR, depending on the composition of the NP through its dielectric function, may be tuned by playing with the relative proportions of both constituents and with the chemical order within such plasmonic BNPs [7–9]. If the LSPR of plasmonic BNPs is a major vector for enhancing photoinduced processes, it can be conversely regarded as a “soft” (non-destructive) probe of their chemical structure (segregation versus alloying) or their possible structural changes upon exposure to reactive environment (oxidation or reduction for example) [10,11]. These plasmonic BNPs are thus efficient sensors, which can be used to follow the kinetics of chemical reactions in real time [9]. They commonly involve coinage metals (Au, Ag, Cu) with an LSPR located in the NUV-visible-NIR range. They can be combined with one another or with nonplasmonic ones (generally transition metals) of catalytic or magnetic interest. In this case, the LSPR is usually strongly damped because of its coupling with a large absorption continuum in the visible range. In principle, coinage metals can also be mixed with other simple metals such as those from column IIIA of the periodic table to generate plasmonic BNPs with a high-quality factor. The choice of trivalent elements is particularly attractive since their dielectric function shows a Drude-like behaviour, with an LSPR shifted in the UV range, far from the edge of interband transitions located in the deep UV. This should allow tuning the LSPR over a rather large spectral range, with a limited degradation of its quality factor and provide several advantages. On the one hand, many biological compounds, such as nucleotide bases, nucleic acids or aromatic amino-acids in cells, have absorption bands in the UV (below λ = 350 nm). An LSPR in this wavelength range could thus be used to improve surface-enhanced spectroscopy for the detection and recognition of such bio-species [12]. On the other hand, it is expected to improve the performance of photocatalytic processes or UV-active solar cells and photovoltaic devices [13,14].
For these reasons, we have chosen to investigate nanoalloys combining silver, which exhibits an LSPR with a high-quality factor, with the trivalent metals indium or aluminium. It is of course important to remember that aluminium and indium are very sensitive to oxidation. Upon exposure to air, the formation of a passivating layer a few nanometers thick is known to protect bulk aluminium from further oxidation [15]. In the case of small NPs the size of this layer becomes of the same order as the size of the NP, which can induce significant perturbations of their structure and related properties. Obtaining pure trivalent NPs, which do not oxidize upon air exposure, therefore remains a challenge. However, mixing indium (or aluminium) with silver is a hopeful alternative as their phase diagrams show stable intermetallic phases, which are expected to remain so at the nanoscale. This has previously motivated us to investigate the optical and structural properties of Ag-In NPs for which the LSPR is in the UV range and silver-rich alloyed phases are fairly stable towards oxidation. LSPR bands in the UV range were measured for the Ag0.5In0.5 composition [10], while a silver-rich alloyed phase was observed using environmental transmission electron microscopy (ETEM) after reduction of oxidized Ag0.25In0.75 BNPs [16]. As phase diagrams of Ag-Al and Ag-In are similar [17], one can expect to highlight stable intermetallic phases in Ag-Al NPs similar to those already observed in Ag-In BNPs with the possibility to observe LSPRs in the UV range.
Hence, a comparison between Ag-In and Ag-Al systems makes sense because they should be analogous. Therefore, the optical and structural properties of Ag x B1-x NPs (B = In or Al, x = 0.25, 0.50, 0.75), fabricated using the same method (laser vaporization), were investigated for various atomic proportions of silver noted x, in order to examine if alloyed phases, stable towards oxidation at the nanoscale, could exist and if an LSPR in the UV range is observed.
Optical spectroscopy and TEM characterization have previously been shown to be complementary [9]. Single BNPs can be characterized by TEM while the optical measurements give global information of a BNP assembly embedded in a transparent matrix and are sensitive to very low oxidation rates not observable by TEM. Therefore, transmission electron microscopy characterizations and energy dispersive X-ray spectroscopy (EDS, also abbreviated EDX or XEDS) were conducted to obtain information concerning the atomic and chemical structure and morphology of the BNPs. Second, ex situ optical absorbance measurements were performed on silica-embedded BNPs, just after fabrication (after exposure to air for a few tens of minutes) or after aging for longer periods. A comparison with Mie calculations in the dipolar approximation provides information about the oxidation state of the BNPs [6]. Annealing experiments in a reducing atmosphere were also attempted to increase the percentage of metallic aluminium or indium in the NPs.
2 General considerations on the two systems Ag-In and Ag-Al
A relevant understanding of the Ag-In and Ag-Al systems depends on the individual properties of their constituents. For Ag-In, silver displays an FCC structure while indium adopts a tetragonal structure (see Tab. 1). Therefore, both structures can be easily distinguished by high-resolution transmission electron microscopy (HRTEM). Bulk silver and indium are moreover miscible (negative enthalpy of mixing) [18]. The Ag-In phase diagram shows a strong miscibility, especially for low proportions of indium with various intermetallic solutions or ordered structures (α-Ag FCC structure with increasing lattice parameter for increasing proportion of indium up to 20% of indium, α’-SC Ag3In and coexistence of α and α’ phases between 20% and 25% of indium, ς-HC Ag7In3 between 25% and 30% of indium, but occurring at higher proportions of indium at higher temperature, SC Ag2In at 30% of indium) [19]. The FCC-Ag4In phase is difficult to discriminate from the silver FCC one by HRTEM because of similar lattice parameters. In contrast, the phases ς-Ag7In3, SC-Ag3In and Ag2In should be identifiable if present.
On the other hand, the difference in the surface energies of silver and indium and the lattice mismatch (around 14%) favours an enrichment of indium on the surface at the nanoscale.
From the analysis of these parameters, we can thus conclude that Ag-In BNPs should form a core@shell structure with an indium shell and an alloyed core. However, indium easily oxidizes upon air exposure and a shell of indium oxide (c-In2O3) spontaneously forms around a silver-rich alloyed core, as already highlighted in our previous works [10,16]. The observation of a metallic indium shell in the NPs requires a rapid analysis after their exposure to air so as to minimize oxidation if the oxidation kinetics is slow enough, or alternatively, to isolate the BNPs from the ambient environment thanks to a protective layer providing a longer term stability. The BNPs may also be transferred into a transmission electron microscope without being exposed to air, as it was done for pure indium NPs for which multiply-twinned particles (MTPs) were clearly observed by HRTEM [20].
For Ag-Al, both materials show an FCC crystallographic structure with very similar lattice parameters (see Tab. 1), which makes them difficult to distinguish by HRTEM. Bulk silver and aluminium are also miscible (their mixing enthalpy is negative) [28], as reflected in the Ag-Al phase diagram showing a high miscibility of aluminium in silver at room temperature while the solubility of silver in aluminium is low at the same temperature [29,30]. Thus, like Ag-In, intermetallic phases are observed for small proportions of aluminium in silver. The various existing phases are the following: FCC based Ag, β-Mn-based Ag3Al (μ-SC Ag3Al), β-phase at higher temperature with the stoichiometry Ag3Al, ζ-HCP Ag2Al phase with a proportion of aluminium, which can increase with temperature. The μ-SC Ag3Al phase has a recognizable lattice parameter, but the diffracted intensities in the fast-Fourier transform (FFT) images are expected to be very low and the diffraction spots will be difficult to highlight making this phase difficult to observe. On the other hand, the highly diffracting planes of the ζ-HCP Ag2Al phase can be confused with planes of other compounds. These analyses lead us to conclude that metallic Ag-Al BNPs should exhibit alloyed phases with possible surface enrichment in aluminium, almost like Ag-In. However, aluminium probably oxidizes faster than indium, and so will the Ag-Al BNPs once exposed to air. Their protection from ambient air is all the more necessary.
Regarding their surface energies, silver has a slightly larger surface energy as compared to aluminium (the difference is much more important between silver and indium) and the lattice mismatch is very small (less than 1%). Thus, the enrichment of aluminium at the surface should be lower as compared to the case of the Ag-In system, especially at the very small size range for which the trend may deviate from that expected for larger BNPs.
Data for In, Ag, Al, Ag-In and Ag-Al (Wigner-Seitz radii (rs), surface energies (Es), LSPR wavelengths (λLSPR) and energies (ELSPR) of a sphere in a porous silica matrix (εm ≈ 2.17) in the dipolar approximation) and crystallographic properties of pure metals, Ag-In and Ag-Al alloys and oxides. All the corresponding references are indicated in the table. BCT, HCP, SC, FCC stand for body-centred tetragonal, hexagonal-closed packed, simple cubic, face-centred cubic lattices, respectively.
3 Experimental methods
3.1 Sample synthesis
Bimetallic NPs are initially produced in high vacuum by a laser vaporization source described in previous papers [31]. The second harmonic of a nanosecond Nd3+:YAG pulsed laser is focused on a rod of the alloy of the desired composition, located in a small chamber under continuous flow of helium gas (a few tens of mbar). The atomic plasma thus generated is rapidly cooled down by collisions with the inert gas, leading to nucleation and growth of small BNPs of a few nm in diameter. The BNPs/gas mixture then expands into vacuum through a conical nozzle in the form of a supersonic beam before entering into a high vacuum chamber. This technique was shown to favour the growth of nanoalloys with the same average composition as the target one [32]. In this work, different target compositions x were used to produce Ag x B1-x NPs (B = In or Al) with x = 0.25, 0.50, 0.75. The x value corresponds to an average with some fluctuations for the produced BNPs.
The charged BNPs can be size-selected before deposition with a quadrupole static deviator acting as an energy selector of the ionized clusters (of about 5% of the produced clusters). Because of the small velocity slip of the clusters, the deviator can be viewed as a mass filter. The average NP size is directly measured by mass spectrometry [33]. Depending on the experiments to be performed, the BNPs can be deposited or co-deposited simultaneously with a transparent amorphous silica matrix (200–300 nm thickness) evaporated by an electron gun on various substrates (TEM grids or a fused silica slide (1 cm × 1 cm, 1 mm thick)). The deposition is performed in a chamber under high vacuum and the substrate is tilted by 45° with respect to the BNP beam and to the matrix beam. The dielectric matrix has a dual benefit. First, it prevents direct contact between the BNPs and the air and minimizes their oxidation, even if its porosity can affect the efficiency of their protection. Second, the low volume fraction of NPs in the thin dielectric films (a few %) obtained by co-deposition prevents significant coalescence and optical coupling between BNPs. With an appropriate shadow mask, the resulting samples are composed of two adjacent areas, a first region with matrix-embedded BNPs and a second region with only the matrix, which serves as the reference in optical measurements. It should be noted that the BNPs can also be co-deposited with the transparent matrix (silica) without size selection under high vacuum, or after size selection under ultra-high vacuum (UHV) followed by a coating with a thin carbon layer before exposure to air.
3.2 Transmission electron microscopy
TEM experiments were performed, either with a FEI TITAN ETEM (80–300 kV) transmission electron microscope G2 operating at 300 kV in high vacuum and corrected for spherical aberrations of the objective lens (C s corrector) or with a JEOL 2100 F transmission electron microscope operating at 200 kV. XEDS spectra were acquired using an Oxford instruments X-Max 80 mm2 SDD detector and the relative atomic percentages were estimated using the acquisition software’s standardless quantification method. For these experiments, NPs were deposited on supported ultrathin amorphous carbon films (ultrathin carbon on holey carbon films, AGAR inc. or Ted Pella inc.). The BNPs may be sandwiched between two silica layers (5 nm thickness) evaporated with the electron gun or co-deposited with the silica matrix to reach conditions close to those used for the synthesis of thin films for optical studies. This should partially protect the BNPs from oxidation. The simple deposition of BNPs (i.e. without any matrix) was also performed, with or without an additional carbon coating in order to obtain a better contrast in the images.
3.3 Optical spectroscopy
The optical transmission spectra of thin films doped with BNPs are recorded with a double beam PerkinElmer spectrophotometer equipped with deuterium and halogen lamps. The residual spurious signal originating from multiple reflections in the thin film may be eliminated by using p-polarized light under Brewster angle incidence [32]. The spectra are plotted in order to represent the sample absorption (the linear absorption coefficient is proportional to the average cluster absorption cross-section). Since the NP density may vary from one sample to another, they are independently scaled and given in arbitrary units (a.u.). The dielectric function of the silica, previously measured by ellipsometry, has an average value 〈εm 〉 = 2.17, corresponding to an average optical index 〈nm 〉=1.47. The experimental values of εm (λ) are used in the following for calculating absorption spectra.
4 Results and discussion
4.1 TEM characterization
The Ag x In1-x and Ag x Al1-x BNPs were characterized by transmission electron microscopy. Figures 1 and 2 display STEM-HAADF and HRTEM images of Ag x In1-x and Ag x Al1-x BNPs after exposure to air for a few tens of minutes.
 |
Fig. 1 TEM images of uncapped Ag x In1-x BNPs, for x = 0.25, 0.50 and 0.75 (from left to right). Both STEM-HAADF and HR-TEM modes reveal that Ag0.75In0.25 BNPs are composed of a mono-phased Ag-rich alloy while Ag0.50In0.50 and Ag0.25In0.75 particles adopt a core@shell structure with an Ag-rich alloyed core and a shell made of c-In2O3. In the cores, several Ag-rich phases (ς-Ag7In3, Ag2In) were identified. Some FCC structures cannot be unambiguously indexed and the existence of pure silver cores in some BNPs cannot be excluded. |
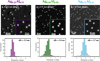 |
Fig. 2 STEM images and size distributions (deduced from STEM image analysis) of Ag x Al1-x NPs, for x = 0.25, 0.50 and 0.75 (from left to right). The largest images show BNPs sandwiched in silica. The indicated diameters correspond to the ones measured by mass spectrometry. Because of the deposition geometry, there is a shadowing effect around the particles that leads to a darker area on one side of the BNPs without SiO2, and a brighter area on the other side where SiO2 accumulates. The images in insert show carbon-protected Ag0.75Al0.25 particles and unprotected Ag0.50Al0.50 and Ag0.25Al0.75 BNPs. A core@shell structure is clearly visible for the last two compositions. Here, only the cores were considered for the size distributions, explaining the difference between the average diameters deduced from the size distributions (noted <Ø>) and those measured by mass spectrometry during the deposition (indicated in the largest images). |
4.1.1 Ag-In
In the case of Ag-In, the BNPs were deposited on amorphous carbon, either under UHV with a subsequent coating of a thin carbon layer or under high vacuum without any protection. Figure 1 shows STEM-HAADF and HRTEM images of Ag x In1-x for the three compositions x = 0.25, 0.50, 0.75. We observe that the BNPs adopt a core@shell structure for x = 0.25 and 0.50. The thickness of the shell increases with the initial proportion of indium. In STEM-HAADF images, the cores are brighter. As silver and indium have similar atomic number (Z = 47 and Z = 49, respectively), the difference in intensity related to Z should be slight. However, the difference in density between silver and indium (10.49 g.cm–3 and 7.31 g.cm–3 for silver and indium, respectively) probably explains the image contrast, suggesting that the core is mainly made of silver. On the contrary, for x = 0.75, no shell is apparent. Investigations performed on size selected BNPs allowed a comparison between the measured size during the deposition with the size deduced from image analysis and a good agreement was obtained. To go further, the NPs were also characterized by HRTEM. The images of the BNPs for the three proportions are shown in Figure 1. For x = 0.25 and 0.50, a crystalline core is observed surrounded by an amorphous shell, which partially crystallises under the electron beam. The crystallites are always indexed as c-In2O3 bixbyite whether or not the BNPs are protected with carbon, suggesting only partial protection from oxidation under such deposition conditions. As a general rule, the cores of ζ or Ag2In alloyed phases can be clearly identified, which is not the case for the cores oriented along a zone axis of an FCC structure as such structures may also coincide with a pure silver phase or an α-Ag FCC structure of very close lattice parameters. In some cases (not shown here), MTPs and icosahedra were observed in the cores, the structures of which depend neither on the conditions of deposition nor on the initial proportion of indium. For x = 0.75, the presence of the shell is not obvious. For many NPs, the indexation shows a silver-rich alloyed phase, such as ζ or Ag2In suggesting that the initial proportion of indium is not systematically recovered within the BNPs. Moreover, even if the BNPs are slightly oxidized, the shell thickness is so small that it cannot be observed in the images.
In the Ag-In system, we can observe a correlation between the chemical configuration and the relative proportion of both metals within the BNPs. The structure evolves with the proportion of indium, namely from a mono-phased Ag-rich alloy to a core@shell structure consisting of a silver-rich alloyed core surrounded by an In2O3 shell of increasing thickness for increasing indium proportion. The existence of pure silver cores cannot be excluded because of the impossibility to precisely index FCC structures. This behaviour is in good agreement with hypotheses deduced from general considerations (phase diagrams showing Ag-rich alloys and segregation rules). The shell of indium (for x = 0.25 and 0.50) probably spontaneously oxidizes upon exposure to air. But the pure metallic systems for these proportions were never observed, so far. Novel and efficient techniques of protection have to be developed to keep the metallic character of the BNPs or they have to be characterized in situ. In this regard, in situ X-ray photoelectron spectroscopy (XPS) experiments are planned in the near future. On the other hand, Ag0.75In0.25 NPs were stocked at ambient air for three weeks to see if they progressively oxidize, but no clear evolution was demonstrated. MTP alloyed phases were still observed suggesting that NPs formed with this initial proportion are more resistant against oxidation, which is in agreement with the alloyed phase observed after reduction of oxidized Ag0.25In0.75 BNPs by ETEM [16].
4.1.2 Ag-Al
For Ag x Al1-x BNPs, the samples were more difficult to prepare as compared to other BNPs synthesized up to now. The experimental conditions to obtain well-defined BNPs are more stringent and require great care in cleaning the surface of the target rod prior to laser vaporization, suggesting that this system is even more sensitive to oxidation from exogenous impurities as compared to the Ag-In system. To compare the size of the BNPs in our samples with the size measured by mass spectrometry during co-deposition, size distributions were systematically performed for the three proportions. The Ag x Al1-x BNPs were sandwiched between two layers of silica to protect them from an excessive oxidation, but due to the porosity of silica, the technique is not really efficient, especially for TEM samples which are very thin (a few nanometers). For x = 0.75, the average size, deduced from the size distribution obtained from the STEM image analysis displayed in Figure 2, is comparable to the one measured by mass spectrometry. Moreover, we do not observe a shell in the image of the same BNPs protected only with carbon, which allows a better contrast (insert in the right image of Fig. 2). For x = 0.50, the average diameter is slightly smaller than the measured one (see Fig. 2). The same BNPs were also deposited without protection in which case we clearly observe a shell around a brighter core (insert in the middle image of Fig. 2). This difference between the size deduced from image analysis and that measured during deposition is related to the non-observation of the shell when the NPs are sandwiched in silica. Indeed the contrast in STEM between aluminium and silicon is very low as their atomic numbers are 13 and 14, respectively and densities of Al and SiO2 are not very different (2.7 g.cm–3 and 2.2 g.cm–3 respectively). For x = 0.25, the average diameter deduced from STEM analysis of images of BNPs in silica is 3.3 nm. This corresponds to the diameter of the cores. The shell is clearly visible in the insert image corresponding to non-protected BNPs (insert in the left image of Fig. 2). It is thicker than for x = 0.50, and even if the contrast is low, the size of the full BNPs seems to be larger than the one measured by mass spectrometry. This can be correlated to a wetting of the aluminium oxide on the surface as already observed for Ag-Fe BNPs [34].
Assuming a pure silver core in an Ag@Al spherical core@shell structure should give a core of 3.1 nm and 2.9 nm in diameter for Ag0.50Al0.50 and Ag0.25Al0.75, respectively. The average diameters of the cores deduced from STEM analysis are larger than the one expected for pure silver cores for the two compositions (3.4 nm and 3.3 nm for Ag0.50Al0.50 and Ag0.25Al0.75, respectively), suggesting that they also contain some aluminium. Therefore, we expect that aluminium is not completely oxidized within the BNPs.
XEDS spectra were acquired on assemblies of Ag x Al1-x BNPs and the estimated relative atomic percentages were found to be consistent, within in the uncertainties of the measurements, with the proportions given by the supplier of the initial alloy targets used in our laser vaporization source. Further analysis of the XEDS data obtained from individual BNPs did not yield interpretable variations in composition between particles. The low X-ray count rate intrinsic to the small volume of the particles in this study results in non-negligible relative errors for each measurement. Unfortunately, increasing the acquisition time of individual spectra to gain more counts results in the electron beam induced destruction of the particle being measured [35]. The standardless XEDS quantification method for the Ag x Al1-x system is further hindered by the need to use the Ag L lines, the multiplicity of the L lines increases the incertitude of the theoretical k-factors used to quantify the relative atomic percentages [36]. Nevertheless, we could show evidence that there is no silver in the shell. On the other hand, the Ag2Al and Ag3Al alloyed phases have not been observed by HRTEM. The only crystallites which can be indexed correspond to families of planes of silver or aluminium. Therefore, it is not possible to conclude about the presence of metallic aluminium from electron microscopy. As far as the shell is concerned, we conclude that it only contains aluminium and no silver, but we did not succeed in crystallizing this oxide shell, as it had been possible for the In2O3 shells in Ag-In BNPs [16].
4.2 Optical studies
4.2.1 Optical spectra just after air exposure – comparison with theoretical calculations
Various samples of Ag x In1-x and Ag x Al1-x BNPs embedded in silica were elaborated. For the Ag-In system, the BNPs were not size-selected before deposition. Their mean diameter is around 4 nm with a size dispersion of about 80% of the diameter. Concerning Ag-Al, the BNPs were size-selected before co-deposition with silica. Their mean diameters are 4.3 nm, 4.1 nm and 3.8 nm for Ag0.25Al0.75, Ag0.50Al0.50 and Ag0.75Al0.25, respectively, with a size dispersion of about 20% of the mean diameter. The absorption spectra of the samples were measured a few tens of minutes after air exposure, and compared to theoretical predictions based on Mie theory in the quasistatic approximation. This assumption is justified by the very small size of the BNPs compared to the excitation wavelength. For calculations, the dielectric functions of silver [37] indium [38], aluminium [37], Al2O3 [37], In2O3 [39] were taken from measurements in the bulk phase. For silver, the dielectric function from Palik [37] was chosen as it fits very well the optical response of pure silver NPs embedded in porous silica [11]. For indium, the dielectric function was evaluated from tabulated data for bulk indium [38] and corresponds to a Drude-like dielectric function with an effective mass m* = 0.95, a collision rate γ = 0.7 eV and an electronic Wigner-Seitz radius rs e−=1.27 Å. As the dielectric functions of the Ag x In1-x and Ag x Al1-x alloys are not known, they are calculated to simplify by averaging the dielectric functions of the pure elements according to their volume ratio, which implies that each material forms a nanodomain for which its bulk dielectric function is relevant [32]. Let us stress that this approximation is very rough. For multi-shell spherical BNPs, absorption spectra were also calculated in the framework of the dipolar approximation [40]. All the calculations were conducted without taking into account the decrease of the electron mean free path in the BNP. Therefore, all the theoretical spectra are less broad and the LSPR is less damped than the experimental ones [41].
4.2.1.1 Ag-In
For Ag-In BNPs, the absorption spectra display a broad, damped, but still well-defined LSPR appearing in the UV range, with a maximum varying from 312 nm to 401 nm for increasing silver proportion from x = 0.25 to x = 0.75 (see Fig. 3c). The spectra are in between the ones expected for pure indium and pure silver NPs embedded in silica, suggesting that metallic indium-silver phases do exist within the BNPs. The spectra are relatively broad, because of inhomogeneous effects (size and shape dispersion and increased damping of the resonance for very small BNPs) [42]. They are compared to calculated ones for BNPs of the corresponding proportions of silver (dotted lines in Fig. 3a). In calculations, we chose a spherical core@shell geometry Ag X o Inλ-X o @In with a silver-rich alloyed core of silver atomic proportion X o = 0.75 close to the composition of stable bulk alloys. The theoretical spectra are clearly blue-shifted as compared to the experimental ones. As indium is suspected to rapidly oxidize upon air exposure, calculations were also performed by taking into account a possible oxidation of indium with a multi-shell spherical structure Ag X c In1-X c @In@In2O3 where X c (≠ X o ) is the silver atomic proportion in the core. We consider that a volumetric proportion V ox of the metallic indium shell is oxidized and transferred to the outer shell. It is defined as:

Both parameters X c and V ox are then adjusted to obtain the best agreement of the spectral position of the LSPR peak-maximum with experimental spectra. This is achieved for silver-rich cores and rates of indium oxidation decreasing for increasing proportion of indium within the NPs (full lines in Fig. 3a). For the nominal proportions of silver x = 0.25, 0.50 and 0.75, we found core concentrations X c = 90%, 92.5% and 95% and oxidation rates of the indium shell V ox = 30%, 50% and 85%, respectively. Under these assumptions, the thickness of the In2O3 outer-shell is almost constant for the three proportions. These results show that the BNPs preserve some fraction of indium in the metallic state for the three compositions Ag0.75In0.25, Ag0.50In0.50 and Ag0.25In0.75 with an increasing proportion of metallic indium (1 – X c) for increasing indium content in the BNPs. As remarked above, the indium oxide shell was not observable in TEM for Ag0.75In0.25 BNPs. The comparison between optical experiments and theoretical calculations shows that Ag0.75In0.25 BNPs are probably slightly oxidized, showing evidence that optical spectroscopy is more sensitive to oxidation than TEM imaging. Nevertheless, we can conclude that the theoretical calculations are in agreement with the existence of metallic indium within the BNPs. Note that transferring indium atoms from the core into the intermediate metallic shell does not noticeably modify the spectral position of the LSPR, the most important parameter being the global proportion of both elements in the metallic state, whatever the chemical arrangement. This observation will be a basis to interpret the time evolution of the optical spectra, discussed in Section 4.2.2.
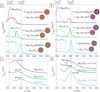 |
Fig. 3 Optical responses of AgxIn1-x (left) and AgxAl1-x (right) for x = 0.75 (light blue), x = 0.50 (green) and x = 0.25 (deep purple). (c, d): experimental spectra of BNPs embedded in silica. AgxAl1-x BNPs were size-selected, while AgxIn1-x BNPs were not. For both compositions, the higher the proportion of Al or In, the more the resonance is blue-shifted. (a, b) simulations performed within the multi-shell model structure. The dotted lines correspond to absorption spectra of AgXoIn1-Xo@In and AgXoAl1-Xo@Al BNPs for the three nominal proportions of silver x = 0.25, 0.50 and 0.75, with Xo = 0.75. In such configurations, the LSPRs are always blue-shifted compared to the experimental spectra. The full lines correspond to absorption spectra taking into account the oxidation of the indium or aluminium shell, resulting in multi-shell structures AgXcIn1-Xc@In@In2O3 or AgXcAl1-Xc@Al@Al2O3 where Xc (≠ Xo) is the silver atomic proportion in the core. For Ag-In and for the nominal proportions of silver x = 0.25, 0.50 and 0.75, the values of Xc are 90%, 92.5% and 95% and the volume percentages of indium oxidation Vox are 30%, 50% and 85%, respectively. For Ag-Al, the spectra in full line correspond to silver atomic proportions in the core Xc = 90%, 92.5% and 100% and volume percentages of aluminium oxidation Vox = 97.5%, 100% and 95%, for nominal concentrations x = 0.25, 0.50 and 0.75, respectively. These amounts of In2O3 and Al2O3 were adjusted to obtain the best agreement of the spectral position of the resonance with experimental spectra. |
4.2.1.2 Ag-Al
The absorption spectra of the Ag-Al BNPs also display well-defined LSPR bands, but less in the UV range as for the Ag-In BNPs. The spectral LSPR maximum varies from 382 nm to 414 nm for increasing silver proportion from x = 0.25 to x = 0.75 (see Fig. 3d). It should be emphasised that the LSPR bands are better defined for Ag-Al BNPs than for Ag-In BNPs. This might be correlated to the narrower size selection. The comparison with theoretical calculations for the core@shell Ag X c Al1-X c @Al structure shows a greater disagreement than for Ag-In, suggesting that aluminium oxidizes more rapidly than indium (dotted lines in Fig. 3b). This is confirmed by calculations within the multi-shell model Ag X c Al1-X c @Al@Al2O3 discussed above for Ag-In BNPs. They show that the volume percentage of oxidized aluminium required to reproduce the experimental spectra is higher than for Ag-In (full lines in Fig. 3b). We obtain a good agreement between experiments and theory concerning the LSPR maximum, for a volume percentage of aluminium oxidation V ox = 97.5%, 100% and 95%, and atomic percentage of aluminium in the cores X c = 90%, 92.5% and 100%, for nominal concentrations x = 0.25, 0.50 and 0.75, respectively. Note that very small variations in the oxidation rates induce noticeable spectral shifts of the LSPR. The proportion of metallic aluminium in Ag-Al BNPS is surely lower than the proportion of indium in Ag-In BNPs of the same composition.
We can nevertheless conclude that for both systems Ag-In and Ag-Al, a substantial amount of indium (or aluminium) remains in metallic state within the BNPs, which is an encouraging result. With a better protection of the BNPs from oxidation, we can hope to increase this amount, or even stabilize the BNPs eventually by using other matrices or maintaining the substrate at a high temperature during deposition [11, 43].
4.2.2 Optical spectra after long term air exposure: aging
The optical absorption spectra of Ag x In1-x and Ag x Al1-x BNPs embedded in silica were measured after being exposed to air for a long time. The spectra just after fabrication and after long term aging are displayed in Figure 4. For Ag-In, we note a strong red-shift of the LSPR for x = 0.25 and x = 0.50, corresponding to the progressive oxidation of the indium shell. For x = 0.75, there is no shift of the LSPR, only a small damping occurs, which is in agreement with the formation of stable silver-rich phases observed by TEM. For Ag-Al, we do not observe a strong evolution of the spectra, except a damping of the LSPR for x = 0.75. It is probably related to the rapid oxidation of aluminium. Once partially oxidized, the BNPs may be stabilized by the surrounding aluminium oxide shell, preventing them from further oxidation. The optical spectra are well reproduced by calculations assuming a silver-rich core surrounded by an In2O3 or Al2O3 shell. By taking the values Xc already used for partially oxidized Ag X c In1-X c @In@In2O3 and Ag X c Al1-X c @Al@Al2O3 (Fig. 3) a good agreement between experiments and theory is obtained for oxidized Ag X c In1-X c @In2O3 and Ag X c Al1-X c @Al2O3 spherical core@shell structures (compare dotted lines and lines in bold in the spectra of Fig. 4). We can thus conclude that, even after air exposure for long time, the cores of the BNPs contains metallic indium or aluminium, suggesting the existence of alloyed phases within the BNPs.
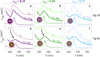 |
Fig. 4 Absorption spectra of Ag x Al1-x (top: a, b, c) and Ag x In1-x (bottom: d, e, f) for x = 0.25 (deep purple), x = 0.50 (green) and x = 0.75 (light blue). The palest continuous curves represent the experimental spectra just after the synthesis of the samples (time t 0), as previously shown in Figure 3c and d. The samples were then exposed to air during several days (t o + n d d, n d being the number of days) and their optical spectra measured (bold continuous curves). In Ag x In1-x BNPs, we observe a strong red-shift of the LSPR for x = 0.25 (d) and x = 0.50 (e), while for x = 0.75 (f), only a small damping occurs. For Ag-Al, we do not observe a strong evolution of the spectra, except a damping of the LSPR for x = 0.75 (c). The dotted lines represent the simulated optical responses for core@shell structures Ag XcAl1-Xc@Al2O3 and Ag XcIn1-Xc@In2O3 BNPs with fully oxidized shells. The silver atomic proportion in the cores are thus 100 % (c), 92.5 % (b), 90 % (a) for Ag-Al, and 95 % (f), 92.5 % (e) and 90 % (d) for Ag-In. The shells are made of pure Al2O3 or In2O3 and are thicker as the amount of Al and In increases. The positions of the resonance with these simulated configurations are in good agreement with the experimental aged spectra. |
4.2.3 Annealing under reducing atmosphere
Attempts to increase the proportion of metallic indium or aluminium within the partially oxidized BNPs were performed by annealing optical samples under reducing atmosphere (H2 (5%)-Ar (95%)). Preliminary results are displayed in Figure 5. For Ag-In, the two samples containing Ag0.25In0.75 and Ag0.75In0.25 BNPs embedded in silica were annealed under H2 atmosphere at 400 °C for 1 h and then at 600 °C also for an additional hour. Surprisingly, the spectra after annealing for both extreme proportions of silver (x = 0.25 and x = 0.75) are very similar. They exhibit a very well defined LSPR with a higher quality factor than observed before, and even better than the one observed for pure silver NPs. Moreover, the spectra evolve very slowly with time, and are hardly attenuated even after a few weeks. The spectral position of the LSPR (at 388 nm) for both compositions can be interpreted only if a proportion of indium is assumed within the BNPs (around 9–10%). Such results are not easy to interpret, but some conclusions may be drawn on the possible evolution of the BNPs during annealing. For x = 0.75, the initial structure should be a slightly oxidized, alloyed Ag-In BNP whereas it is a core@shell Ag-In@In2O3 configuration for x = 0.25. During annealing, we may induce a restructuration and a reduction of the indium oxide. For the high proportion of indium, the reduction may be accompanied by a diffusion of the reduced indium atoms within the matrix. This can explain why the final system corresponds to a silver-rich alloyed phase whatever the initial proportion of silver (x = 0.25 or 0.75). This effect is of the same order as the one occurring during the disappearing of the In2O3 shell during reduction of oxidized Ag-In BNPs observed by ETEM [16]. Moreover, we probably have a spherization of the BNPs during annealing and maybe an increasing size due to coalescence, which could explain the high-quality factor of the LSPR. The annealing is also known to improve the crystallinity of the BNPs, and thus the Drude-like behaviour of the alloy in the BNPs.
For Ag-Al, various assays of annealing were carried out and the best results were obtained when annealing at 500 °C for 90 min. The corresponding spectra are shown in Figure 5. For both investigated silver proportions x = 0.25 and x = 0.75, the LSPR bands are blue-shifted and well defined after annealing with an LSPR band maximum around 371 nm. This suggests that the BNPs are partly reduced during annealing, but it remains difficult from optical spectra to conclude about the restructuration during annealing. The position of the LSPR maximum after annealing in the case of Ag-Al suggests that the proportion of metallic aluminium is higher than in the case of Ag-In. To go further, other experiments have to be performed, but such preliminary results remain encouraging.
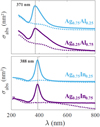 |
Fig. 5 Experimental spectra of Ag x Al1-x (top) and Ag x In1-x (bottom) for x = 0.75 (light blue) and x = 0.25 (deep purple) before annealing (dotted lines) and after annealing under reducing atmosphere (full lines). Ag-Al samples were annealed at 500 °C during 90 min whereas Ag-In samples were annealed for one hour at 400 °C and then 1 h at 600 °C. The spectral position of the LSPR band in the UV-range proves the presence of metallic aluminium and indium in the BNPs. |
5 Conclusion and perspectives
Ag-In and Ag-Al BNPs of different proportions of silver were systematically investigated using TEM and optical spectroscopy allowing complementary information to be obtained.
Ag-In BNPs are shown to adopt either alloyed phases for silver-rich BNPs (x = 0.75) or a core@shell structure for other proportions of silver (x = 0.50 and x = 0.25) with a silver-rich alloyed core surrounded by an indium-oxide shell. If the BNPs are embedded in silica, they are only partially oxidized after a few tens of minutes, the silica matrix effectively slows down the oxidation, but does not inhibit it. The indium-containing shell progressively oxidizes with time. For Ag0.75In0.25, the initial proportion of indium corresponds to a stable alloyed phase of the bulk, explaining the higher resistance against oxidation of these BNPs. The preliminary results concerning annealing under reducing atmosphere also lead us to conclude that silver-rich alloyed phases are the more stable ones.
Ag-Al BNPs rapidly oxidize after air exposure. They also adopt a mixed Ag-Al core surrounded by a shell of aluminium oxide, but the actual state of aluminium (alloyed at the atomic level or in a segregated phase) within the core is more difficult to determine. For the highest proportion of silver (x = 0.75), the shell cannot be detected by STEM. Concerning their optical response, the spectra are in agreement with BNPs containing a substantial amount of aluminium in its metallic state, but smaller as compared to Ag-In. This amount can nevertheless be increased by annealing under reducing atmosphere.
In summary we show that it is possible to fabricate and stabilize Ag-In and Ag-Al BNPs in at least partially metallic and alloyed phases. In order for their LSPR to be stable for their use in the UV range, more efficient techniques for the protection against oxidation have to be developed.
To better characterize the internal structure of Ag-Al BNPs, more sophisticated analytical techniques, such as synchrotron-based X-ray diffraction spectroscopy [44,45], are currently under way. In situ XPS measurements and low energy ion scattering (LEIS) [46] could also provide precious information about the chemical state of the constituent elements and the initial structure (core@shell versus alloying) of the systems before air exposure. From the theoretical point of view, the atomic structure of the BNPs will also be determined by total-energy calculations as well as their optical response in the very small size range using ab-initio or semi-quantal methods [1]. In the near future, the restructuration of the BNPs under controlled atmosphere will be investigated by ETEM, as well as STEM electron energy loss spectroscopy (EELS) to measure the plasmonic response at the single BNP level with sub-nanometer spatial resolution [35].
The authors declare no competing financial interests.
Supplementary material
Table SI1: Values used in the optical simulations.
Author contribution statement
All the authors participated in this work which also corresponds to part of the thesis work of E. Camus (Ag-Al and Ag-In) and part of the thesis work from J. Ramade (Ag-In). More specifically the samples were fabricated by E. Camus, J. Ramade, M. Pellarin, M. Hillenkamp and E. Cottancin. E. Camus, J. Ramade, N. Blanchard, C. Langlois, L. Roiban, M. Hillenkamp and E. Cottancin participated to the TEM and EDX characterisation. The optical studies (experiments and simulations) were performed by E. Camus, M. Pellarin and E. Cottancin. The manuscript was written by E. Cottancin and E. Camus and carefully and critically reviewed by all the authors.
Acknowledgments
The samples were elaborated at the PLYRA facility with technical support from C. Albin, O. Boisron, C. Clavier and S. Hermelin who are warmly thanked. The authors also gratefully acknowledge the Centre Technologique des Microstructures (CTμ) and especially Xavier Jaurand for his availability and technical expertise. The authors also thank the Consortium Lyon Saint-Etienne de Microscopie (CLYM) for access to the FEI Titan ETEM. The authors acknowledge TEM access provided by the METSA network.
The authors would like to acknowledge support from GDR 3182 Nanoalliages, European COST Action MP1302 Nanospectroscopy and the Nanoalloys International Research Network IRN CNRS “Nanoalloys”. This work was also partially financed by the French National Research Agency (Agence Nationale de Recherche, ANR) via the project ‘SchNAPSS’, ANR-21-CE09-0021.
References
- D. Alloyeau, C. Mottet, C. Ricolleau, Nanoalloys (Springer London, London, 2012) [CrossRef] [Google Scholar]
- R. Ferrando, Struct. Propert. Nanoalloys (Elsevier, 2016), Vol 10 [Google Scholar]
- F. Calvo, Nanoalloys: From Fundamentals to Emergent Applications (Elsevier, 2020) [Google Scholar]
- S. García, L. Zhang, G.W. Piburn, G. Henkelman, S.M. Humphrey, ACS Nano 8 , 11512 (2014) [CrossRef] [PubMed] [Google Scholar]
- U. Kreibig, M. Vollmer, Optical Properties of Metal Clusters (Springer, Berlin, 1995) [CrossRef] [Google Scholar]
- C. Emmanuel, B. Michel, L. Jean, P. Michel, in Handbook of Nanophysics (CRC Press, 2010), pp. 1–25. [Google Scholar]
- M. Broyer, E. Cottancin, J. Lermé, M. Pellarin, N.D. Fatti, F. Vallée, J. Burgin, C. Guillon, P. Langot, Faraday Discussion (2007), accepted. [Google Scholar]
- G. Barcaro, L. Sementa, A. Fortunelli, M. Stener, Phys. Chem. Chem. Phys. 17 , 27952 (2015) [CrossRef] [PubMed] [Google Scholar]
- F. Rabilloud, E. Cottancin, M. Pellarin, in Nanoalloys (Second Edition), edited by F. Calvo (Elsevier, Oxford, 2020), pp. 151–192 [Google Scholar]
- E. Cottancin, C. Langlois, J. Lermé, M. Broyer, M.-A. Lebeault, M. Pellarin, Phys. Chem. Chem. Phys. 16 , 5763 (2014) [CrossRef] [PubMed] [Google Scholar]
- J. Ramade, E. Cottancin, M.-A. Lebeault, C. Langlois, L. Piccolo, M. Broyer, M. Hillenkamp, J. Lermé, F. Calvo, M. Pellarin, J. Phys. Chem. C 123 , 15693 (2019) [CrossRef] [Google Scholar]
- S.K. Jha, Z. Ahmed, M. Agio, Y. Ekinci, J.F. Löffler, J. Am. Chem. Soc. 134 , 1966 (2012) [CrossRef] [PubMed] [Google Scholar]
- U. Aslam, V.G. Rao, S. Chavez, S. Linic, Nat. Catal. 1 , 656 (2018) [CrossRef] [Google Scholar]
- H.A. Atwater, A. Polman, Nat. Mater. 9 , 205–213 (2010) [CrossRef] [PubMed] [Google Scholar]
- D. Gérard, S.K. Gray, J. Phys. D: Appl. Phys. 48 , 184001 (2014) [Google Scholar]
- J. Ramade, C. Langlois, M. Pellarin, L. Piccolo, M.A. Lebeault, T. Epicier, M. Aouine, E. Cottancin, Nanoscale 9 , 13563 (2017) [CrossRef] [PubMed] [Google Scholar]
- F. Predel, in Phase Equilibria, Crystallographic and Thermodynamic Data of Binary Alloys, edited by F. Predel (Springer, 2016) [CrossRef] [Google Scholar]
- W.A. Badawi, A.M. Oun, Bull. Chem. Soc. Jpn. 62 , 304 (1989) [CrossRef] [Google Scholar]
- H. Okamoto, J. Phase Equilib. Diffusion 27 , 535 (2006) [CrossRef] [Google Scholar]
- Q. Chen, M. Tanaka, K. Furuya, Surf. Sci. 440 , 398 (1999) [CrossRef] [Google Scholar]
- N.W. Ashcroft, N.D. Mermin, Solid State Physics (International Edition, Saunders College, Philadelphia, 1976) [Google Scholar]
- W. Tyson, W. Miller, Surf. Sci. 62 , 267 (1977) [CrossRef] [Google Scholar]
- W.B. Pearson, A Handbook of Lattice Spacings and Structures of Metals and Alloys (Elsevier, 1958) [Google Scholar]
- A.N. Campbell, R. Wagemann, R.B. Ferguson, Can. J. Chem. 48 , 1703 (1970) [CrossRef] [Google Scholar]
- J.K. Brandon, R.Y. Brizard, W.B. Pearson, D.J.N. Tozer, Acta Crystallogr., Sect. B 33 , 527 (1977) [CrossRef] [Google Scholar]
- M. Marezio, Acta Crystallogr. 20 , 723 (1966) [CrossRef] [Google Scholar]
- C.T. Prewitt, R.D. Shannon, D.B. Rogers, A.W. Sleight, Inorg. Chem. 8 , 1985 (1969) [CrossRef] [Google Scholar]
- L. Gastaldo, G. Gallinaro, F. Gatti, D. Pergolesi, M.R. Gomes, P. Repetto, S. Dussoni, R. Valle, P. Manfrinetti, A. Chincarini, Nucl. Instrum. Methods Phys. Res., Sect. A 559 , 465 (2006) [CrossRef] [Google Scholar]
- A.J. McAlister, Bull. Alloy Phase Diagr. 8 , 526–533 (1987) [CrossRef] [Google Scholar]
- P.J. Spencer, O. Kubaschewski, Monatshefte für Chemie / Chem. Monthly 118 , 155 (1987) [CrossRef] [Google Scholar]
- A. Perez, P. Mélinon, V. Dupuis, L. Bardotti, B. Masenelli, F. Tournus, B. Prevel, J. Tuaillon-Combes, E. Bernstein, A. Tamion, N. Blanc, D. Tainoff, O. Boisron, G. Guiraud, M. Broyer, M. Pellarin, N.D. Fatti, F. Vallée, E. Cottancin, J. Lermé, J.-L. Vialle, C. Bonnet, P. Maioli, A. Crut, C. Clavier, J.L. Rousset, F. Morfin, Int. J. Nanotechnol. 7 , 523 (2010) [CrossRef] [Google Scholar]
- M. Gaudry, E. Cottancin, M. Pellarin, J. Lermé, L. Arnaud, J. Huntzinger, J. Vialle, M. Broyer, J. Rousset, M. Treilleux, P. Mélinon, Phys. Rev. B 67 , 155409 (2003) [CrossRef] [Google Scholar]
- R. Alayan, L. Arnaud, A. Bourgey, M. Broyer, E. Cottancin, J.R. Huntzinger, J. Lermé, J.L. Vialle, M. Pellarin, G. Guiraud, Rev. Sci. Instrum. 75 , 2461 (2004) [CrossRef] [Google Scholar]
- J. Ramade, N. Troc, O. Boisron, M. Pellarin, M.A. Lebault, E. Cottancin, V.T.A. Oiko, R.C. Gomes, V. Rodrigues, M. Hillenkamp, Nano Res. 11 , 6074 (2018) [CrossRef] [Google Scholar]
- A. Campos, N. Troc, E. Cottancin, M. Pellarin, H.-C. Weissker, J. Lermé, M. Kociak, M. Hillenkamp, Nat. Phys. 15 , 275 (2019) [CrossRef] [Google Scholar]
- P.J. Sheridan, J. Electr. Microscopy Tech. 11 , 41 (1989) [CrossRef] [PubMed] [Google Scholar]
- E.D. Palik, Handbook of Optical Constants of Solids (Academic Press, New York, 1985–1991) [Google Scholar]
- J. Lemonnier, G. Jezequel, J. Thomas, J. Phys. C 8 , 2812 (1975) [CrossRef] [Google Scholar]
- I. Hamberg, C.G. Granqvist, K.F. Berggren, B.E. Sernelius, L. Engström, Vacuum 35 , 207 (1985) [CrossRef] [Google Scholar]
- C.F. Bohren, D.R. Huffman, Absorption and Scattering of Light by Small Particles (Wiley-VCH, Weinheim, 2004) [Google Scholar]
- J. Lermé, H. Baida, C. Bonnet, M. Broyer, E. Cottancin, A.L. Crut, P. Maioli, N. Del Fatti, F. Vallée, M. Pellarin, J. Phys. Chem. Lett. 1 , 2922 (2010) [CrossRef] [Google Scholar]
- H. Baida, P. Billaud, S. Marhaba, D. Christofilos, E. Cottancin, A. Crut, J. Lermé, P. Maioli, M. Pellarin, M. Broyer, N.D. Fatti, F. Vallée, A. Sanchez-Iglesias, I. Pastoriza-Santos, L.M. Liz-Marzan, Nanoletters 9 , 3463 (2009) [CrossRef] [PubMed] [Google Scholar]
- C. Langlois, P. Benzo, R. Arenal, M. Benoit, J. Nicolai, N. Combe, A. Ponchet, M.J. Casanove, Nano Lett. (2015) [Google Scholar]
- P. Andreazza, A. Lemoine, A. Coati, D. Nelli, R. Ferrando, Y. Garreau, J. Creuze, C. Andreazza-Vignolle, Nanoscale 13 , 6096 (2021) [CrossRef] [PubMed] [Google Scholar]
- P. Andreazza, V. Pierron-Bohnes, F. Tournus, C. Andreazza-Vignolle, V. Dupuis, Surf. Sci. Rep. 70 , 188 (2015) [CrossRef] [Google Scholar]
- E. Cottancin, M. Gaudry, M. Pellarin, J. Lermé, L. Arnaud, J.R. Huntzinger, J.L. Vialle, M. Treilleux, P. Mélinon, J.L. Rousset, M. Broyer, Eur. Phys. J. D 24 , 111 (2003) [CrossRef] [Google Scholar]
Cite this article as: Élise Camus, Julien Ramade, Michel Pellarin, Nicholas Blanchard, Matthias Hillenkamp, Cyril Langlois, Lucian Roiban and Emmanuel Cottancin, Structural and optical properties of silver-indium and silver-aluminium nanoalloys: stability against oxidation, Eur. Phys. J. Appl. Phys. 97, 59 (2022)
All Tables
Data for In, Ag, Al, Ag-In and Ag-Al (Wigner-Seitz radii (rs), surface energies (Es), LSPR wavelengths (λLSPR) and energies (ELSPR) of a sphere in a porous silica matrix (εm ≈ 2.17) in the dipolar approximation) and crystallographic properties of pure metals, Ag-In and Ag-Al alloys and oxides. All the corresponding references are indicated in the table. BCT, HCP, SC, FCC stand for body-centred tetragonal, hexagonal-closed packed, simple cubic, face-centred cubic lattices, respectively.
All Figures
|
Fig. 1 TEM images of uncapped Ag x In1-x BNPs, for x = 0.25, 0.50 and 0.75 (from left to right). Both STEM-HAADF and HR-TEM modes reveal that Ag0.75In0.25 BNPs are composed of a mono-phased Ag-rich alloy while Ag0.50In0.50 and Ag0.25In0.75 particles adopt a core@shell structure with an Ag-rich alloyed core and a shell made of c-In2O3. In the cores, several Ag-rich phases (ς-Ag7In3, Ag2In) were identified. Some FCC structures cannot be unambiguously indexed and the existence of pure silver cores in some BNPs cannot be excluded. |
| In the text | |
|
Fig. 2 STEM images and size distributions (deduced from STEM image analysis) of Ag x Al1-x NPs, for x = 0.25, 0.50 and 0.75 (from left to right). The largest images show BNPs sandwiched in silica. The indicated diameters correspond to the ones measured by mass spectrometry. Because of the deposition geometry, there is a shadowing effect around the particles that leads to a darker area on one side of the BNPs without SiO2, and a brighter area on the other side where SiO2 accumulates. The images in insert show carbon-protected Ag0.75Al0.25 particles and unprotected Ag0.50Al0.50 and Ag0.25Al0.75 BNPs. A core@shell structure is clearly visible for the last two compositions. Here, only the cores were considered for the size distributions, explaining the difference between the average diameters deduced from the size distributions (noted <Ø>) and those measured by mass spectrometry during the deposition (indicated in the largest images). |
| In the text | |
|
Fig. 3 Optical responses of AgxIn1-x (left) and AgxAl1-x (right) for x = 0.75 (light blue), x = 0.50 (green) and x = 0.25 (deep purple). (c, d): experimental spectra of BNPs embedded in silica. AgxAl1-x BNPs were size-selected, while AgxIn1-x BNPs were not. For both compositions, the higher the proportion of Al or In, the more the resonance is blue-shifted. (a, b) simulations performed within the multi-shell model structure. The dotted lines correspond to absorption spectra of AgXoIn1-Xo@In and AgXoAl1-Xo@Al BNPs for the three nominal proportions of silver x = 0.25, 0.50 and 0.75, with Xo = 0.75. In such configurations, the LSPRs are always blue-shifted compared to the experimental spectra. The full lines correspond to absorption spectra taking into account the oxidation of the indium or aluminium shell, resulting in multi-shell structures AgXcIn1-Xc@In@In2O3 or AgXcAl1-Xc@Al@Al2O3 where Xc (≠ Xo) is the silver atomic proportion in the core. For Ag-In and for the nominal proportions of silver x = 0.25, 0.50 and 0.75, the values of Xc are 90%, 92.5% and 95% and the volume percentages of indium oxidation Vox are 30%, 50% and 85%, respectively. For Ag-Al, the spectra in full line correspond to silver atomic proportions in the core Xc = 90%, 92.5% and 100% and volume percentages of aluminium oxidation Vox = 97.5%, 100% and 95%, for nominal concentrations x = 0.25, 0.50 and 0.75, respectively. These amounts of In2O3 and Al2O3 were adjusted to obtain the best agreement of the spectral position of the resonance with experimental spectra. |
| In the text | |
|
Fig. 4 Absorption spectra of Ag x Al1-x (top: a, b, c) and Ag x In1-x (bottom: d, e, f) for x = 0.25 (deep purple), x = 0.50 (green) and x = 0.75 (light blue). The palest continuous curves represent the experimental spectra just after the synthesis of the samples (time t 0), as previously shown in Figure 3c and d. The samples were then exposed to air during several days (t o + n d d, n d being the number of days) and their optical spectra measured (bold continuous curves). In Ag x In1-x BNPs, we observe a strong red-shift of the LSPR for x = 0.25 (d) and x = 0.50 (e), while for x = 0.75 (f), only a small damping occurs. For Ag-Al, we do not observe a strong evolution of the spectra, except a damping of the LSPR for x = 0.75 (c). The dotted lines represent the simulated optical responses for core@shell structures Ag XcAl1-Xc@Al2O3 and Ag XcIn1-Xc@In2O3 BNPs with fully oxidized shells. The silver atomic proportion in the cores are thus 100 % (c), 92.5 % (b), 90 % (a) for Ag-Al, and 95 % (f), 92.5 % (e) and 90 % (d) for Ag-In. The shells are made of pure Al2O3 or In2O3 and are thicker as the amount of Al and In increases. The positions of the resonance with these simulated configurations are in good agreement with the experimental aged spectra. |
| In the text | |
|
Fig. 5 Experimental spectra of Ag x Al1-x (top) and Ag x In1-x (bottom) for x = 0.75 (light blue) and x = 0.25 (deep purple) before annealing (dotted lines) and after annealing under reducing atmosphere (full lines). Ag-Al samples were annealed at 500 °C during 90 min whereas Ag-In samples were annealed for one hour at 400 °C and then 1 h at 600 °C. The spectral position of the LSPR band in the UV-range proves the presence of metallic aluminium and indium in the BNPs. |
| In the text | |
Current usage metrics show cumulative count of Article Views (full-text article views including HTML views, PDF and ePub downloads, according to the available data) and Abstracts Views on Vision4Press platform.
Data correspond to usage on the plateform after 2015. The current usage metrics is available 48-96 hours after online publication and is updated daily on week days.
Initial download of the metrics may take a while.