Fig. 2
Download original image
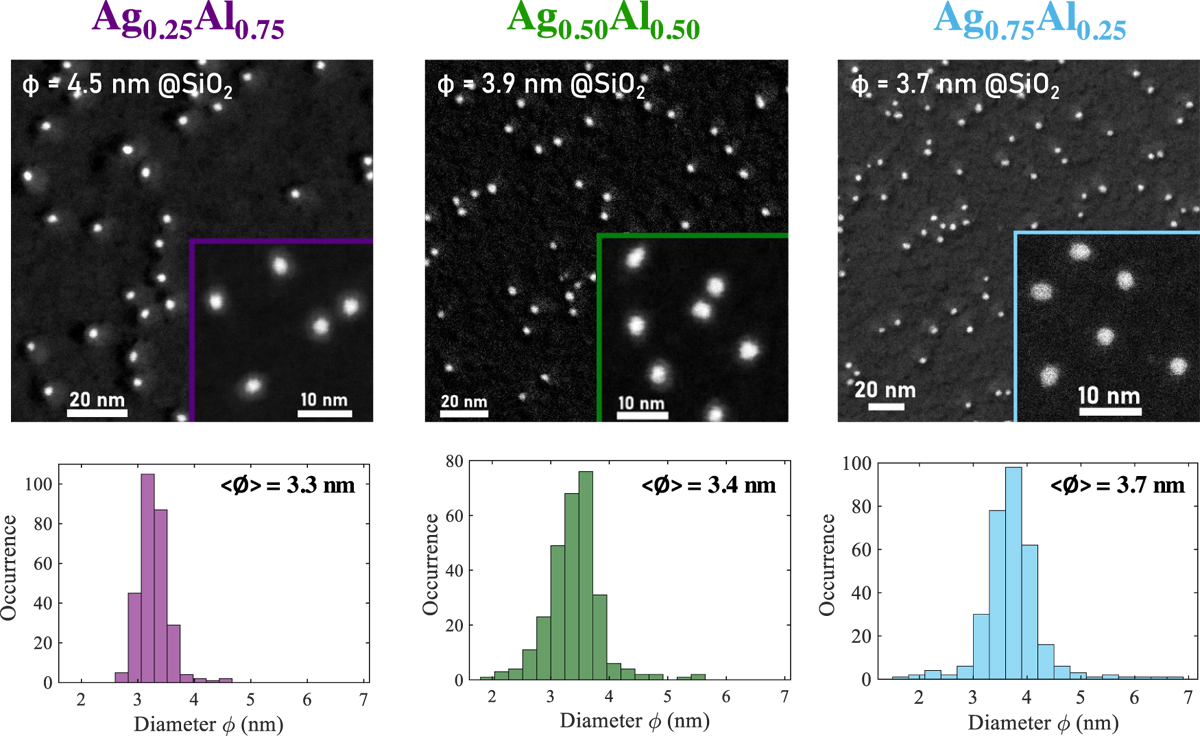
STEM images and size distributions (deduced from STEM image analysis) of Ag x Al1-x NPs, for x = 0.25, 0.50 and 0.75 (from left to right). The largest images show BNPs sandwiched in silica. The indicated diameters correspond to the ones measured by mass spectrometry. Because of the deposition geometry, there is a shadowing effect around the particles that leads to a darker area on one side of the BNPs without SiO2, and a brighter area on the other side where SiO2 accumulates. The images in insert show carbon-protected Ag0.75Al0.25 particles and unprotected Ag0.50Al0.50 and Ag0.25Al0.75 BNPs. A core@shell structure is clearly visible for the last two compositions. Here, only the cores were considered for the size distributions, explaining the difference between the average diameters deduced from the size distributions (noted <Ø>) and those measured by mass spectrometry during the deposition (indicated in the largest images).
Current usage metrics show cumulative count of Article Views (full-text article views including HTML views, PDF and ePub downloads, according to the available data) and Abstracts Views on Vision4Press platform.
Data correspond to usage on the plateform after 2015. The current usage metrics is available 48-96 hours after online publication and is updated daily on week days.
Initial download of the metrics may take a while.