Fig. 4
Download original image
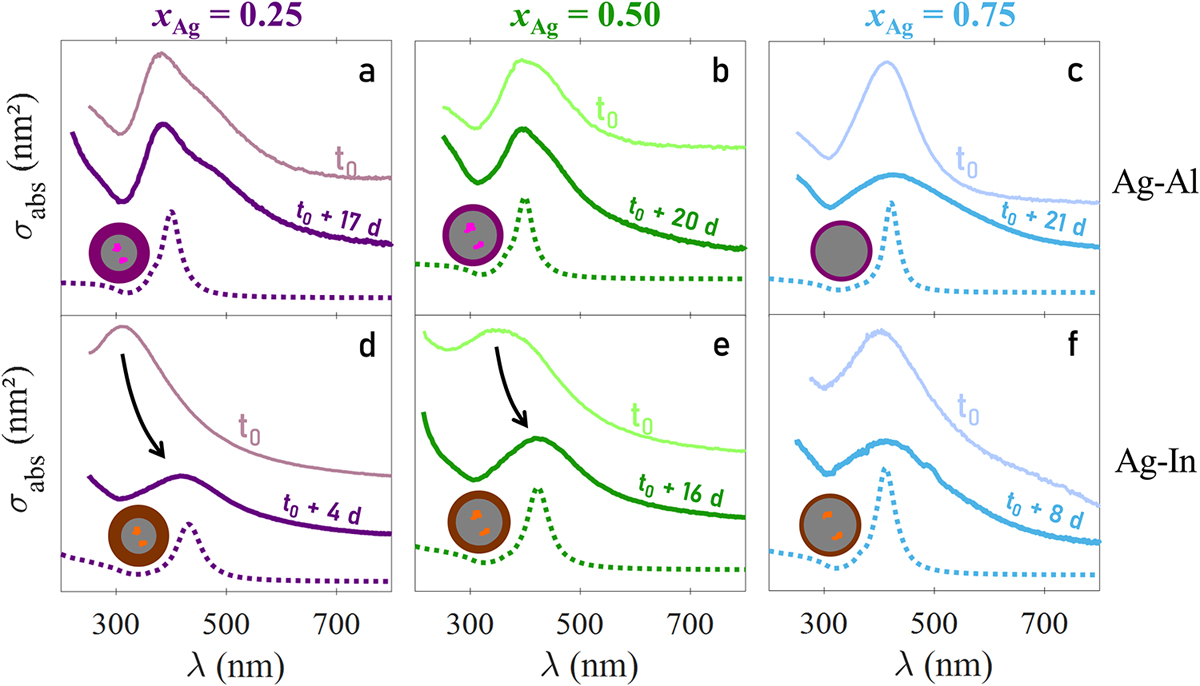
Absorption spectra of Ag x Al1-x (top: a, b, c) and Ag x In1-x (bottom: d, e, f) for x = 0.25 (deep purple), x = 0.50 (green) and x = 0.75 (light blue). The palest continuous curves represent the experimental spectra just after the synthesis of the samples (time t 0), as previously shown in Figure 3c and d. The samples were then exposed to air during several days (t o + n d d, n d being the number of days) and their optical spectra measured (bold continuous curves). In Ag x In1-x BNPs, we observe a strong red-shift of the LSPR for x = 0.25 (d) and x = 0.50 (e), while for x = 0.75 (f), only a small damping occurs. For Ag-Al, we do not observe a strong evolution of the spectra, except a damping of the LSPR for x = 0.75 (c). The dotted lines represent the simulated optical responses for core@shell structures Ag XcAl1-Xc@Al2O3 and Ag XcIn1-Xc@In2O3 BNPs with fully oxidized shells. The silver atomic proportion in the cores are thus 100 % (c), 92.5 % (b), 90 % (a) for Ag-Al, and 95 % (f), 92.5 % (e) and 90 % (d) for Ag-In. The shells are made of pure Al2O3 or In2O3 and are thicker as the amount of Al and In increases. The positions of the resonance with these simulated configurations are in good agreement with the experimental aged spectra.
Current usage metrics show cumulative count of Article Views (full-text article views including HTML views, PDF and ePub downloads, according to the available data) and Abstracts Views on Vision4Press platform.
Data correspond to usage on the plateform after 2015. The current usage metrics is available 48-96 hours after online publication and is updated daily on week days.
Initial download of the metrics may take a while.