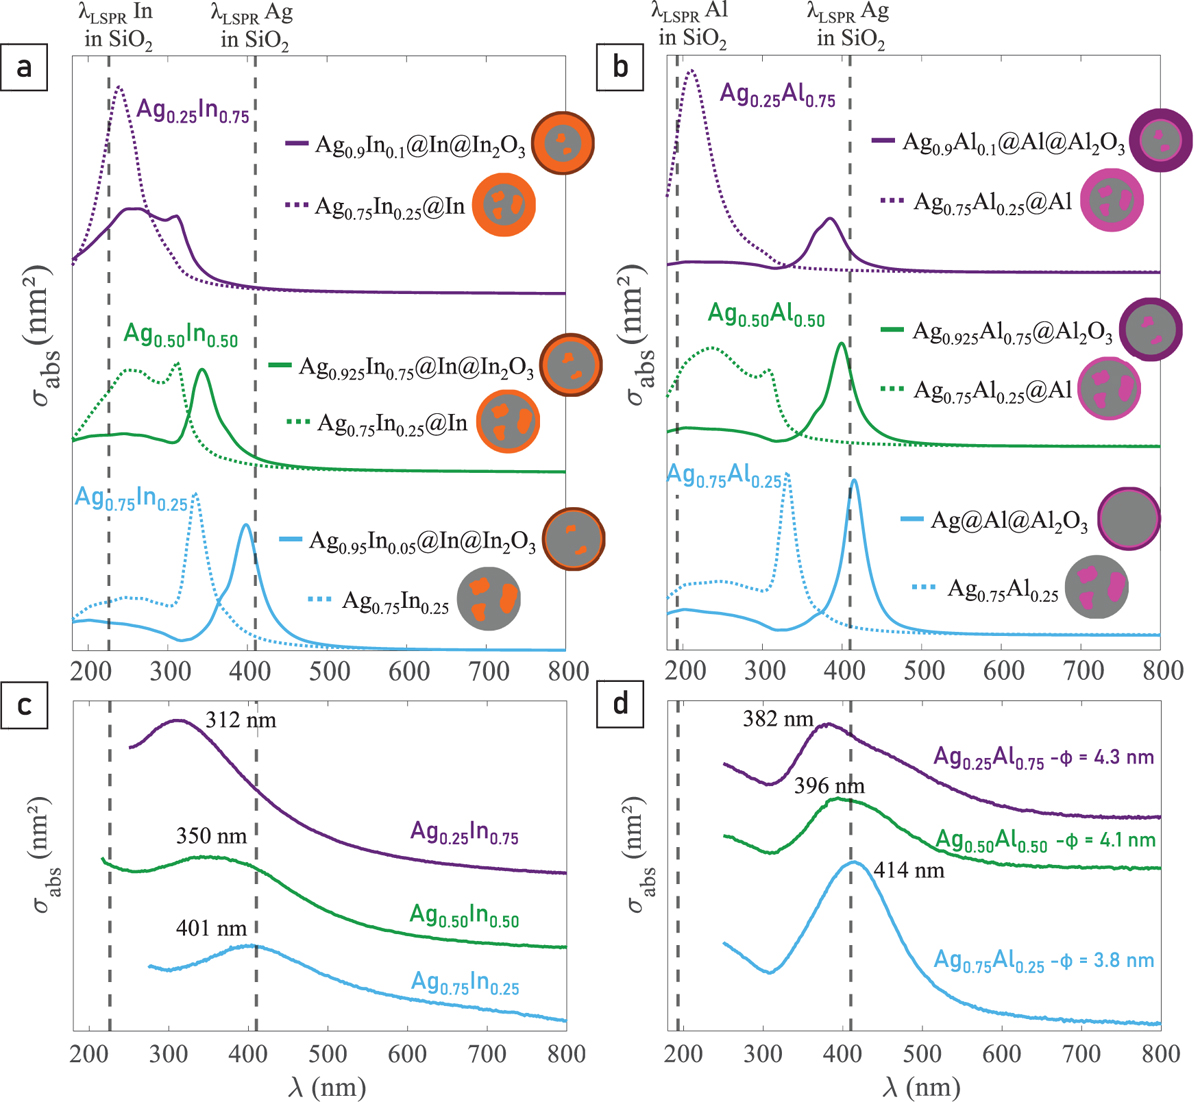
Fig. 3
Download original image
Optical responses of AgxIn1-x (left) and AgxAl1-x (right) for x = 0.75 (light blue), x = 0.50 (green) and x = 0.25 (deep purple). (c, d): experimental spectra of BNPs embedded in silica. AgxAl1-x BNPs were size-selected, while AgxIn1-x BNPs were not. For both compositions, the higher the proportion of Al or In, the more the resonance is blue-shifted. (a, b) simulations performed within the multi-shell model structure. The dotted lines correspond to absorption spectra of AgXoIn1-Xo@In and AgXoAl1-Xo@Al BNPs for the three nominal proportions of silver x = 0.25, 0.50 and 0.75, with Xo = 0.75. In such configurations, the LSPRs are always blue-shifted compared to the experimental spectra. The full lines correspond to absorption spectra taking into account the oxidation of the indium or aluminium shell, resulting in multi-shell structures AgXcIn1-Xc@In@In2O3 or AgXcAl1-Xc@Al@Al2O3 where Xc (≠ Xo) is the silver atomic proportion in the core. For Ag-In and for the nominal proportions of silver x = 0.25, 0.50 and 0.75, the values of Xc are 90%, 92.5% and 95% and the volume percentages of indium oxidation Vox are 30%, 50% and 85%, respectively. For Ag-Al, the spectra in full line correspond to silver atomic proportions in the core Xc = 90%, 92.5% and 100% and volume percentages of aluminium oxidation Vox = 97.5%, 100% and 95%, for nominal concentrations x = 0.25, 0.50 and 0.75, respectively. These amounts of In2O3 and Al2O3 were adjusted to obtain the best agreement of the spectral position of the resonance with experimental spectra.
Current usage metrics show cumulative count of Article Views (full-text article views including HTML views, PDF and ePub downloads, according to the available data) and Abstracts Views on Vision4Press platform.
Data correspond to usage on the plateform after 2015. The current usage metrics is available 48-96 hours after online publication and is updated daily on week days.
Initial download of the metrics may take a while.