Fig. 6
Download original image
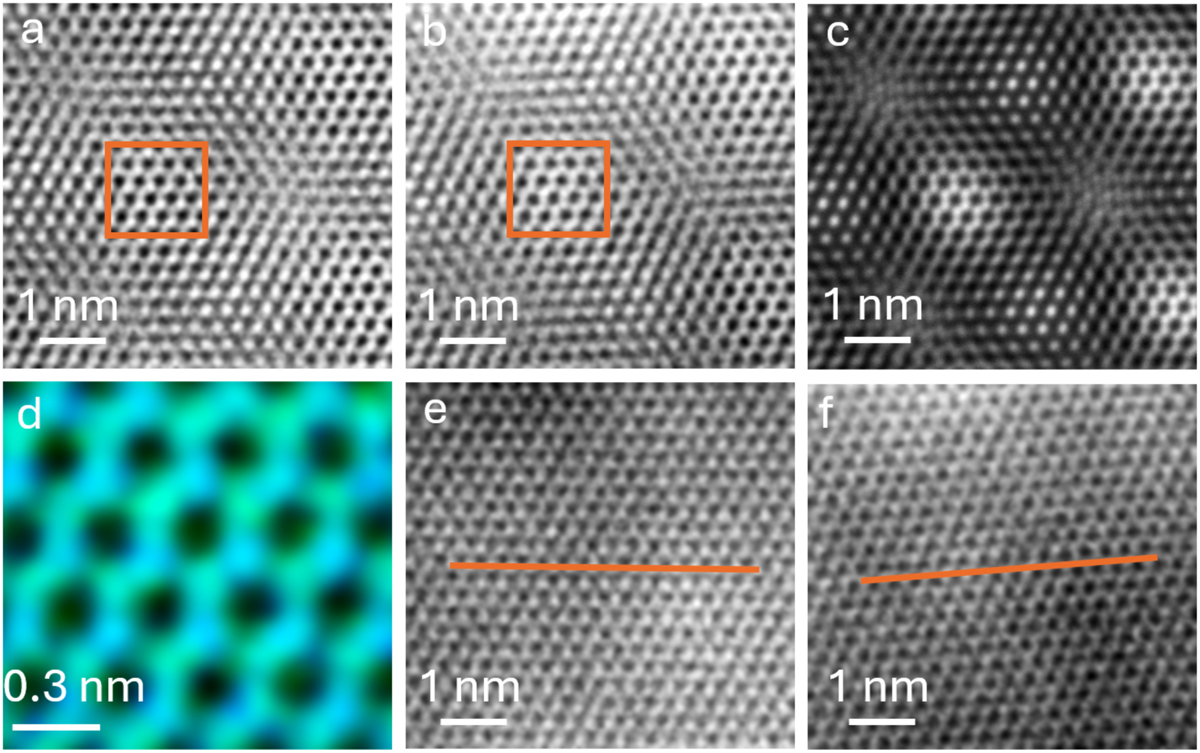
Twisted bilayer MoS2 simultaneously imaged with (a) entrance, and (b) exit side SE, and (c) MAADF. (d) is a composite of the boxed regions in (a) and (b), with the entrance and exit contributions shown in blue and green. (e) and (f) are linear combinations of the entrance and exit signals that suppress the signal from the far layer of the sample, which makes the lattice orientations (indicated by orange lines) and the 5° twist angle readily visible.
Current usage metrics show cumulative count of Article Views (full-text article views including HTML views, PDF and ePub downloads, according to the available data) and Abstracts Views on Vision4Press platform.
Data correspond to usage on the plateform after 2015. The current usage metrics is available 48-96 hours after online publication and is updated daily on week days.
Initial download of the metrics may take a while.