Fig. 3
Download original image
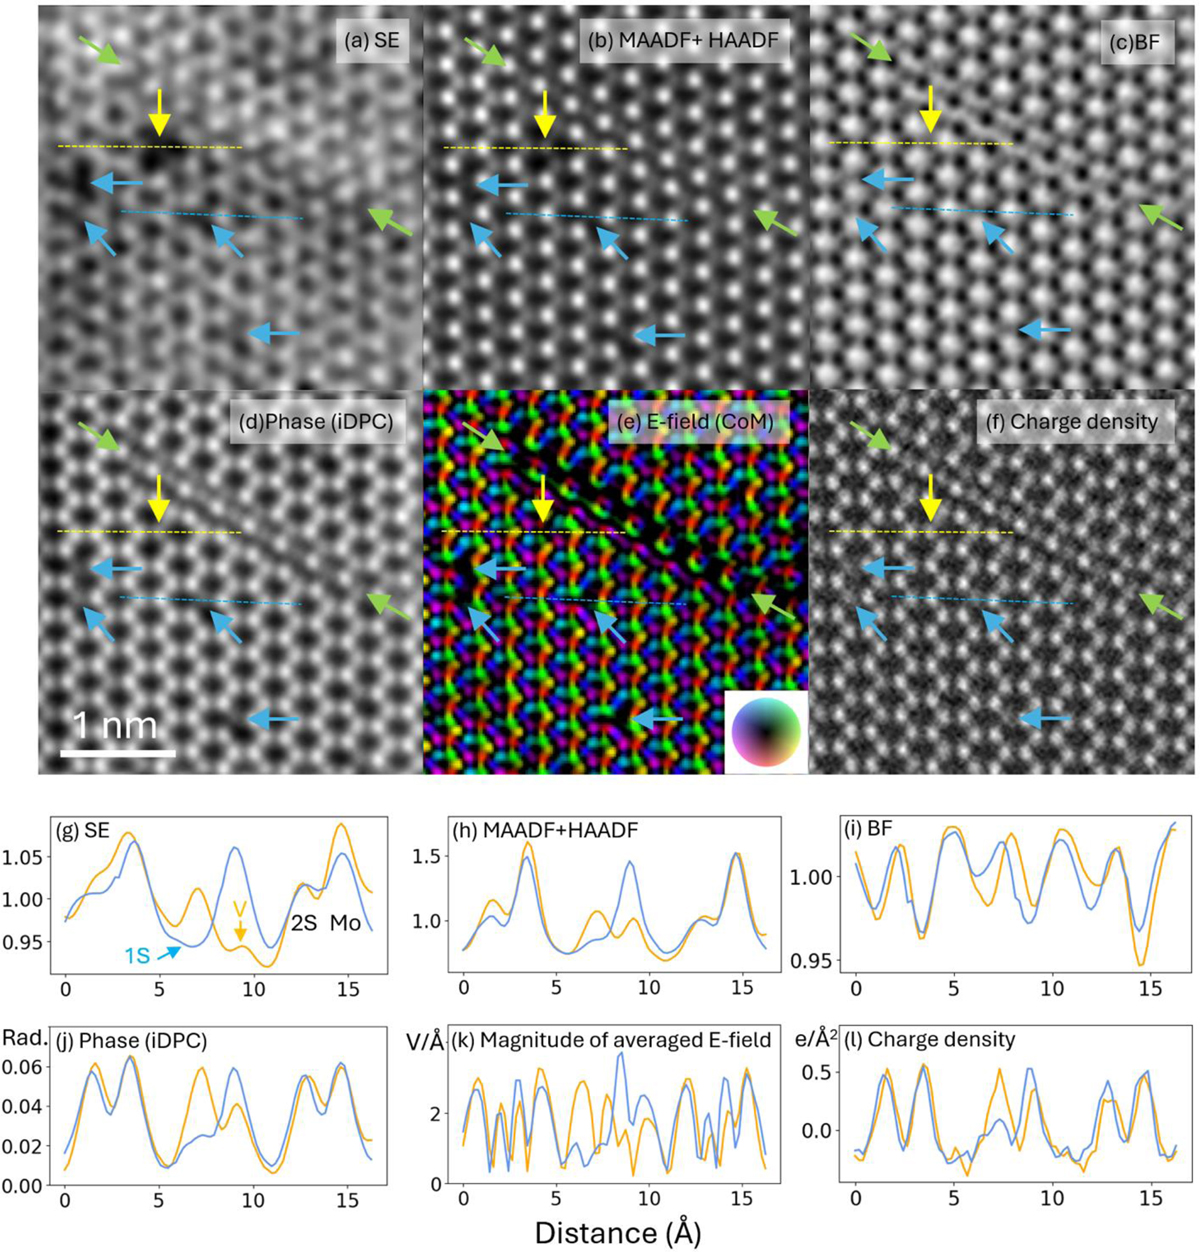
Simultaneously acquired images of vanadium-doped monolayer MoS2: (a) SE, (b) MAADF+HAADF, (c) virtual bright field (BF), (d) phase, (e) transverse electric field worked out by center-of-mass (CoM) analysis, (f) charge density, (g-l) line profiles through a V substitution and an S vacancy along the dashed lines marked in the six images. The transverse electric field profile (k) shows the signal magnitude, and all the signals except the SE one are integrated (projected) in Z. Green arrows point to a line defect, yellow arrow to a substitutional vanadium atom, and blue arrows to sulphur vacancies. Note that atoms are dark in the BF image (c and i), doughnut-like in (the magnitude of) the transverse electric field image (e and k), and bright in all the other images. The arrows and line profile markers are in identical positions in all the images, and the tips of the blue arrows are ∼0.17 nm away from the atomic sites they point to, so that they do not obscure the images of the atoms.
Current usage metrics show cumulative count of Article Views (full-text article views including HTML views, PDF and ePub downloads, according to the available data) and Abstracts Views on Vision4Press platform.
Data correspond to usage on the plateform after 2015. The current usage metrics is available 48-96 hours after online publication and is updated daily on week days.
Initial download of the metrics may take a while.