| Issue |
Eur. Phys. J. Appl. Phys.
Volume 97, 2022
Special Issue on ‘Nanoalloys: Kinetic and Environmental Behaviour’, edited by Pascal Andreazza, Riccardo Ferrando and Liu Xiaoxuan
|
|
|---|---|---|
| Article Number | 56 | |
| Number of page(s) | 10 | |
| Section | Nanomaterials and Nanotechnologies | |
| DOI | https://doi.org/10.1051/epjap/2022220027 | |
| Published online | 01 September 2022 | |
https://doi.org/10.1051/epjap/2022220027
Regular Article
Out-of-equilibrium supported Pt-Co core-shell nanoparticles stabilized by kinetic trapping at room temperature★
1
Interfaces, Confinement, Matériaux et Nanostructures, ICMN, Université d’Orléans, CNRS,
1B, rue de la Férollerie,
45071
Orléans Cedex, France
2
Institut Néel, CNRS, Université Joseph Fourier,
BP 166,
38042
Grenoble Cedex 9, France
3
Institut des Nanotechnologies de Lyon, CNRS, Ecole Centrale de Lyon,
36 avenue Guy de Collongue,
69134
Ecully, France
4
Conditions Extremes et Matériaux: Hautes Temperatures et Irradiations, CEMHTI, CNRS,
45071
Orleans Cedex, France
a Present address: Département de Physique, Faculté des Sciences et des Sciences Appliquées, Université de Bouira, 10000, Algérie
* e-mail: This email address is being protected from spambots. You need JavaScript enabled to view it.
Received:
6
February
2022
Received in final form:
18
April
2022
Accepted:
25
April
2022
Published online: 1 September 2022
Abstract
The chemical stability of supported CoPt nanoparticles in out-of-equilibrium core-shell configurations was investigated mainly by anomalous grazing incidence small angle X-ray scattering (AGISAXS) in association with combined transmission electron microscopy and X-ray absorption spectroscopy. CoPt nanoparticles were prepared at room temperature by ultrahigh vacuum atom beam deposition using two different routes: simultaneous deposition of the two metals (CoPt) or sequential deposition. In this last case, Co deposition on a Pt-core (Pt@Co) and the reverse configuration (Co@Pt) are explored. In the Pt@Co case, our experimental analysis of 2.5 nm particles shows the stability of a Pt rich-core (80% Pt) surrounded by a two-monolayers-thick Co shell. In the reverse case, the core-shell structure is also stabilized, while the codeposited sample leads to an alloyed structure. These results suggest that the growth kinetics can trap the thermodynamically non-favorable core-shell structure even for this system which has a high alloying tendency. Besides the lack of atom mobility at room temperature, this stabilization can also be associated with core strain effects. Post thermal treatment of core-shell samples induces a structural transition from the core-shell configuration to the equilibrium alloyed configuration. This study demonstrates that the element-selective scattering technique, AGISAXS is highly efficient for the extraction of chemical segregation information from multi-component supported nanoparticles, such as core-shell structures, up to ultimate small sizes.
Supplementary material is available in electronic form at https://www.epjap.org/10.1051/epjap/2022220027
© H. Khelfane et al., Published by EDP Sciences, 2022
 This is an Open Access article distributed under the terms of the Creative Commons Attribution License (https://creativecommons.org/licenses/by/4.0), which permits unrestricted use, distribution, and reproduction in any medium, provided the original work is properly cited.
1 Introduction
Bimetallic nanoparticles (NPs) have received considerable attention because besides the size reduction effect, the addition of a second metal provides a method to control their properties and functionalities [1–3]. In magnetic data storage applications, most of 3d-based NPs exhibit a decrease of magnetization and magnetic anisotropy due to surface contamination (poisoning, oxidation, ligands). At the same time, in heterogeneous catalysis, a decrease of catalytic activity can be due to inappropriate arrangement of atoms in the particles (poisoning, segregation). In both cases, using core-shell nanoparticles can be a great solution depending on the nature of the shell. In fact, core-shell NPs present even more attractive features than a simple protective or stabilizing function, due to the unusual electronic or magnetic properties of shells alone or combined with the properties of the core [1,4]. However, these properties are depended on kinetically- and thermodynamically-controlled growth mechanisms which influence the stability of the core-shell structure. These different mechanisms depend on intrinsic parameters of metals such as binding strengths, surface energies, atomic radii, as well as extrinsic aspects related to preparation methods or experimental conditions, such as the nature of substrates when supported or the nature of matrix when embedded, environment, temperature and deposition rate, that contribute to the formation of many types of nanoalloy structures.
Among nanoalloys, CoPt nanostructures are very interesting systems because they offer the possibility to tune the magnetic properties by changing the composition and the chemical order [5]. In particular, the Pt neighborhood around Co atoms can induce an enhancement of the magnetic moment and anisotropy [6,7]. However, at nanosize, due to the presence of numerous atomic configurations or defects (partial alloying, oxidation, surface disorder, strain, etc), magnetic properties can greatly differ from the expected performance [8–11]. Recent electrocatalysis studies suggest that Pt alloyed with Co, may not only help to reduce the loading of Pt, but also allow the individual functional components to work synergistically to enhance the catalytic performance toward the improvement of the oxygen reduction reaction [12, 13]. In addition, the core–shell configuration can induce core-to-shell strain effect which is extensively used in (electro)catalysis to promote the shell metal performance [14]. These behaviors motivate the development of core–shell CoPt-based particles for three distinct features [15–17]; (i) the core–shell structure is able to maintain favorable properties of the core (magnetism in particular) while protecting the nanoparticles from oxidation thanks to the shell; (ii) the shell can enhance the properties of the core (magnetic, catalytic); (iii) the core only stabilizes the structure of the particle whereas the useful property results from the shell.
However, producing and stabilizing a CoPt core–shell structure is not an easy task, and few researchs examine these mechanisms [15, 18]. Core-shell nanoparticles are produced mainly by wet chemical methods [15,22–24], for which the core–shell structure is mostly induced or stabilized by an environment effect (synthesis media, ligands). In fact, the synthesis of a core of one metal surrounded by a thin shell of another metal can be achieved via two main fabrication strategies [1,4,5]: the first one is to take advantage of the difference of surface energy and atomic size of the two metals in order to promote the segregation of one metal; the second one is to trap the core–shell arrangement in a metastable state by a kinetic or environment effect. The former case is difficult to achieve in the Co-Pt system due to the strong tendency of CoPt alloying [10,19,20] although several theoretical works based on DFT calculations [8,21] show a tendency of Pt segregation at the surface of CoPt NPs. In the latter, the metastable state is trapped by sequential preparation: one type of metal is often first nucleated (or deposited) and forms the core, while the second metal is grown in a second step as a shell (surrounding the nucleated core).
Thus, the goal of this work was to control the formation and the stability of core–shell NPs to provide a chemically- or magnetically-active coating around a metallic core. The objective was to investigate the stability of CoPt NPs, prepared at room temperature by a physical method and different routes, and to study the consequence of thermal treatments (annealing) which can induce a higher mobility of species (atoms and sometimes particles). The sequential deposition (Co deposited on the Pt-core named Pt@Co and the reverse configuration Co@Pt) and the co-deposition (Co and Pt together named CoPt) were compared. Firstly, we will focus our attention on the element-selective morphological and structural characterizations of the stability of a thermodynamically non-favorable Co-Pt atom arrangement: Pt@Co. Secondly, this structural configuration will be compared with those of CoPt and Co@Pt routes. The study after thermal treatments will allow the question of stability of core–shell or alloyed structure to be addressed. Several techniques were combined to provide a comprehensive description of NPs, difficult to achieve without complementarity and cross-fertilization effects between techniques. We have performed a two absorption edge (Co K and Pt L3) analysis of XANES (X-ray absorption near edge structure) measurements supplemented with a EXAFS (extended X-ray absorption fine structure) [25] signal interpretation to obtain the cross-checked local structure around each of the two elements. Transmission electron microscopy (TEM) has given the actual size distribution and morphology of the NPs. The largest experimental part of information was obtained by anomalous grazing incidence small angle X-ray scattering (Anomalous GISAXS, i.e. AGISAXS). Small-Angle X-ray Scattering (SAXS) is a well-established technique giving information on spatial correlation and morphological features of nanometric or submicrometric objects [26]. The scattering intensity collected close to the X-ray incidence is directly related to large-scale inhomogeneities in the electron density of the probed material. In nanoalloys, the scattering contributions of heterogeneities in particles (phase separation, surface segregation) can be disentangled using the anomalous effect taking advantage of the variation of the scattering factor close to an absorption edge of a given element [27,28]. For nano-objects supported on a dense substrate, limiting the probed depth, the combination of grazing incidence small-angle X-ray scattering [26,29,30] with the anomalous technique (AGISAXS) provides a powerful method to extract the scattering data from multi-component supported NPs, such as core–shell structures [31,32].
Detecting chemical order or demixing in nanoalloys, experimentally is a non-trivial issue. Consequently the development and combination of relevant methods to determine the size, shape, structural and chemical arrangements, and spatial organization of NPs assemblies are still key challenges. This paper presents an application of such combined approach of CoPt nanoalloy phase separation, comparing co-deposited and sequentially-deposited NPs in the 1–4 nm size range.
2 Experimental
2.1 Particle Preparation
Co and Pt atoms were deposited at room temperature, in a UHV chamber using electron beam evaporation, leading to the formation of 1-4nm NPs. The base pressure was typically a few 10−10 mbar to avoid any contamination during the deposition. Preliminarily degassed at 600 °C, Si with its SiO2 native layer coated with an amorphous carbon (a-C) layer was chosen as substrate to limit the cluster–substrate interactions [20] during the metal condensation. Consequently, the NPs were randomly oriented on the substrate. Co and Pt deposition rates were calibrated to control the amount of the deposited metal and the average composition during co-deposition or sequential deposition. These rates (0.2–0.6× 10¹⁵ atoms/cm2/h) were selected as low as possible in order to induce an atomic rearrangement at room temperature during the growth (self-annealing effect) within the bimetallic NPs [33]. After deposition, the supported NPs were covered by an amorphous alumina cover layer for AGISAXS and XAS experiments, to avoid Co oxidation, as demonstrated in previous studies [37]. This protected layer is deposited in situ under UHV just after metallic nanoparticle deposition. To confirm this assumption, the chemical state of each covered sample was checked by X-ray photoelectron spectroscopy (XPS). Uncovered samples were used for TEM observations and to post-check the composition of the NP assembly by an average method, Rutherford backscattering spectroscopy (RBS) and a local method, energy dispersive X-ray spectroscopy (EDX). In all cases, the local composition on a few particles obtained in STEM-EDX mode are the same as the average composition, especially for as-grown nanoparticles, with a width of compositional distribution of less than 5%.
2.2 Analysis Methods
The scattering experiments were performed at the SWING beamline at the Synchrotron Facility SCLEIL (France) using a two-dimensional AVIEX CCD camera. The sample-detector distance was set to 1200 mm in order to optimize the q range of the data collection with respect to the particle size. The incidence angles, αi = 0.45° and 0. 60° used for Pt L3 and Co K absorption edges respectively, for all samples are significantly larger than the critical angles of the Al2O3 coverlayer and the a-C underlayer to allow the scattering of CoPt NPs. GISAXS 2D pattern were recorded in an adapted framework, as a function of the in-plane qy and out-of-plane qz components respectively, parallel and perpendicular to the substrate [38,39]. The in-plane intensity informs about the particle correlations (in-plane patterning) and the size distribution while out-of-plane intensity contains only shape information. The detailed experimental procedure for data collection and data handling is described in references [31,32]. The small angle scattering was measured at six energies just below the Co K and the Pt L3 edges, corresponding to a scattering factor variation of 3.4 and 6.6 electrons respectively. The analysis methods were of two types, referred to “direct method” and “differential method” [28,32,40]. In the direct method, the intensities I(q, E) measured at different energies were fitted directly with calculated models taking into account the variation of the scattering factor with energy, extracting the morphological parameters. In the differential method, the partial structure factors were first extracted from the difference between the intensities measured at different energies with various levels of approximation [41]. At this stage a qualitative interpretation of the data is possible, prior to model fitting. This allows the selection of relevant morphological models. Our AGISAXS data at both edges were analyzed by the combination of the two methods.
Figure 1 displays the 2D GISAXS pattern collected at an energy far from the Pt edge. The 2D patterns reveal the in-plane and out-of-plane organization and shape of the NP assembly. In the direct method, the form factor (corresponding to a truncated sphere shape with a size dispersion) and the structure factor were simultaneously fitted with calculated scattering profiles from at least two experimental cross sections (intensity cuts), in the qy and qz directions (Figs. 1b–1c) [26,39,42,43].
In addition, XAS spectra at the Co K (7709 eV) and Pt L3-edges (11564eV) of supported CoPt particles and Co3Pt bulk material were recorded at the European Synchrotron Radiation Facility ESRF (BM30 FAME station, Grenoble, France) [34]. Data were collected at 4K and at RT over an extended energy range: 11450 to 12 200keV for Pt, and 7600 to 8500 eV for Co, using a 30-element fluorescence detector. XANES was interpreted in comparison with litterature results on CoPt nanosized granular films of differents compositions [11,44] and pure Co, Pt and Co3Pt bulk reference samples. EXAFS measurements were performed only on two samples with a methodology explained in the electronic supplementary material.
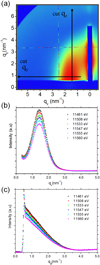 |
Fig. 1 (a) Two-dimensional GISAXS patterns of the Pt-Co sample measured near the Pt L3 edge (intensity in log scale). (b) qy and (c) qz one-dimensional cross-sections (qy and qz cuts in (a)) measured at different energies show the anomalous intensity variation in linear scale. |
3 Results and Discussion
3.1 Sequential Pt@Co Deposition
Figure 2 shows TEM images illustrating the morphological evolution of supported NPs prepared by sequential deposition at room temperature: Pt NPs were obtained first by a Volmer-Weber nucleation mode [20,45] up to an average diameter of 1.2 nm, then Co atoms were deposited on the Pt cores. While the NP average size increased during Co deposition, the density of clusters remained constant close to 1 × 10¹³ NPs/cm2 (Figs. 2a and 2b). Then, static coalescence between NPs occurs (Fig. 2c) and the density drops progressively down to 0.8 × 10¹³ NPs/cm2. During this second stage, the elementary neighboring NPs coalesce. This phenomenon is still limited to the amount deposited (5.5 × 10¹⁵ atoms/cm2). From these TEM images, the diameter distribution of elementary particles [20,46] can be fitted with a Gaussian function allowing the determination of the mean NP diameter D and the width of size distributions, which remained narrow with a constant relative geometrical standard deviation σ(D)/D around 0.3. These results show that no nucleation of Co NP occurs outside Pt core sites. This behavior is due to the high Pt particle density, the nucleation sites on the substrate being already saturated by Pt atoms. All Co atoms are deposited on Pt cores. The initial particles remain almost individual until a composition of PtCo3 (Figs. 2b and 2c). At this stage, the open issue is: what is the atom arrangement in these particles: an out-of equilibrium core–shell configuration or an alloyed state?
To achieve a clear evidence of the core–shell nanostructure formation of these Pt@Co samples, X-ray absorption spectroscopic analysis was also performed, with a strictly parallel procedure, for co-deposited samples showing similar average composition (PtCo3) and particle size distribution (centered around 2–2.5 nm). Normalized XANES spectra at the Co K edge for Co-Pt NPs are shown in Figure 3a, along with the Co3Pt alloyed bulk spectrum, plotted for reference. Changes in the intensity and shape of the edge shoulder and the white line (denoted as feature A and B, respectively, in Fig. 3a) are appreciable and reflect changes in the electronic structure of the Co and Pt atoms. The shoulder A is assigned to transitions from the 1s levels to the unoccupied states mainly originating from the 4p orbitals. In bulk systems, this feature varies upon alloying of Co and Pt, reflecting a population rearrangement between the electronic levels. A drop of the A shoulder is expected to be concomitant of a lowering of the 4p band at Co sites with increasing number of Pt neighbors (see the inset of Fig. 3a). Such a drop was already observed in previous work [44]. The band structure effect for bulk alloy compounds is observed as a split of the white line B, while the nanoparticle samples show a broad white line.
Let us recall that the Co K-edge white line (labelled peak B1-B2) reflects the 4p empty states of Co near the Fermi energy, while the pre-edge feature (labelled peak A) arises from transitions to more localized unoccupied 3d states, influenced by Co 4p-3d hybridization. The intensity of peaks B1-B2 depends on both the number of available 4p states, and the structure of the system. The shape of the white line of NP samples is less structured than the Co3Pt alloyed bulk sample but closer to the codeposited sample than the Pt@Co sample. In addition, the reduction of the intensity of shoulder A in the CoPt samples with respect to that of a pure Co sample reveals a delocalization of the Co 3d empty states, and is a proof of Co 4p-3d/Pt 5d hybridization [11]. In our samples, it is a first signature of the low amount of Pt atoms in the neighborhood of Co in Pt@Co samples. As at the Co K-edge, normalized XANES spectra at the Pt L3-edge for the Co-Pt samples are shown in Figure 3b, along with that of a Co3Pt alloyed bulk for comparison. Since Pt is a 5d metal, the L3 absorption edge appears for transitions from 2p to both 5d3/2 and 5d5/2 bands. In general, the white line feature of the Pt L3 in the CoPt samples is reduced as the amount of Pt in the alloyed sample decreases [11]. Figure 3b does not show variations in the XANES signal between codeposited and sequential samples, no significante difference in the nature of the neighborhood of Pt is evidenced.
Structural parameters for the nearest-neighbor NN atoms, obtained from the fit of the experimental spectra (as shown in the Supplementary Material), are shown in Table 1. These data were obtained from the simultaneous first-shell fitting of the Co and Pt edges. The uncertainties on structural parameters were estimated from the standard deviations of the experimental data. Let us first examine the results for the samples obtained by codeposition. The interatomic distances between the Co-Co and Pt-Pt nearest neighbor were 2.55 and 2.70 Å, respectively and 2.63 Å between the Co-Pt NN atoms which is consistent with the values measured by several authors [44,47] for alloyed CoPt nanoparticles. Moreover, the fact that RCoCo, RCoPt and RPtPt are different [47,48] also implies that the particles are either strained with significant relaxation as the result of size reduction, or partially chemically ordered [44]. Interestingly, the mean-square deviation parameter σ2 is unusually large (close to 1 × 10⁻² Å2) for all bonds. This is the signature of a significant dispersion of the NN distances. More trivially, the resulting Co and Pt first shell coordination numbers Ntot = 8.1 ± 0.5 and 8.6 ± 1, respectively are less than the bulk fcc value of 12, owing to the small size of NPs and the relatively large number of surface atoms with small coordination numbers. Considering the Co and Pt neighbors, Table 1 shows that: (i) the total coordination numbers for Pt and Co nearest-neighbors are similar, (ii) the number of Pt or Co neighbors surrounding a given emitter are nearly identical, i.e. the number of Co scatterers and Pt scatterers around Co (or Pt) are nearly the same. These two considerations are in agreement with a local structure of co-deposited particles in a mixed state, and consistent with an alloyed model (Fig. 4a).
Turning now to the sequentially deposited particles, the local structure appears different. Concerning the number of nearest neighbors, Table 1 shows that they are not similar. This behavior can be interpreted as a phase separation between Co and Pt atoms. Moreover, the first shell coordination numbers for Pt and Co are different: Ntot = 7.4 ± 1 and 11.9 ± 1 for Co and Pt atoms respectively. This significant NN difference reflects a segregation of Co and Pt species, consistent with the hypothesis of a Pt-rich core (maximum coordination value) surrounded by a Co-rich shell (low value due to surface atoms). These EXAFS data in terms of number of Pt-Co Co-Co and Pt-Pt bonds are in accordance with those expected for the core–shell model structures (Fig. 4) and are very different from the PtCo alloy one. Similar EXAFS results from both absorption edges were found in the case of core–shell particles prepared by complex sequential chemical methods: in dendrimer-encapsulated Pd-Pt and Pd-Cu [49] or oxidized Pt-Ru particles.[50] The Co-Co and Pt-Pt homo-atomic bond lengths (2.53 and 2.74 Å, respectively), spread apart more largely than for the codeposited sample and get closer to the values found in the bulk monometallic phases (average values for the bulk face-centered cubic (fcc) phase of Co and Pt of 2.51 and 2.77 Å, respectively [5]). It is worth noting that the RCo–Co distances are larger while the RPt–Pt distances are shorter compared to the bulk values. Although contracted bonds are commonly observed in metallic nanoparticles due to their lower coordination environment, [51,52] it appears that for these samples, the Pt-Pt distances were not fully relaxed with the Co deposition. Interestingly, the σ2 parameter remains large for both Co-Co and Co-Pt bonds, but decreases for Pt-Pt bonds (0.5 × 10⁻² Å2), indicating that the core has a higher degree of order. These results reveal the stabilization of the core–shell structure which may be related to the core strain effect.
Further evidences of the core–shell morphology of the sequentially grown NPs can be obtained more directly from differential analysis of AGISAXS measurements. Small angle scattering is collected at two energies near the Pt L3- absorption edge and two energies near the Co K- absorption edge ((E2) and (E1), near and far from the edge respectively). The form factor of a heterogeneous particle with a core diameter Dc and a shell thickness ΔR is dependent on electron densities of the core and of the shell (for the CoPt system, the Pt scattering factor is three times larger than the Co one). Thus, the variation of intensity between two energies at the Co edge is characteristic of the Co part of the particle and similarly, of the Pt part at the Pt edge. Figure 5 shows the out-of-plane scattering intensity from the entire particle and the difference ΔI = I(E1) − I(E2) for sequentially deposited Pt@Co particles, where E1 and E2 are the energies 11461 and 11560 eV near the Pt L3 edge and 7606 and 7705 eV near the Co K edge, respectively. The I and ΔI are significantly different at the Pt-edge (Fig. 5a), which reflects the size difference between the entire particle (Co and Pt parts) and the Pt part. We did not observe the same effect at the Co K edge (Fig. 5b). These two behaviors can be explained by the presence of Co in the entire particle, while the Pt is confined in the core. However, due to the high difference between atomic scattering power of Co and Pt, at the Pt edge, the homogeneous part (Pt-Pt) is dominant in the differential intensity, while at the Co edge, the Co-Pt and Co-Co terms are equivalent. Consequently, a model of a pure Co-shell/Pt-core is also compatible, which would give also a small variation of intensity at the shell edge (Co) as observed here.
Quantitative morphological parameters were obtained from the direct method. The GISAXS intensity were fitted in the distorded wave Born approximation (DWBA) framework using IsGISAXS software [42]. The output morphological parameters (inset in Fig. 6) were the NP diameter D, height H and interparticle distance Λ, and especially in the case of core–shell structure, the core diameter Dc and the shell thickness ΔR = (D − Dc)/2 [32,35,36]. The best results were obtained with a spherical shape truncated by the substrate surface with an aspect ratio H/D < 1. A narrow Gaussian size distribution with relative geometrical standard deviation close to σ(D)/D = 0.3 was used for each simulation. Several form factors were used: homogeneous alloyed and totally or partially Co-Pt separated core–shell NPs. The best fit corresponds to a core–shell configuration in agreement with the results suggested by the differential method. The fitting results shown in Figure 6, gave D = 2.8 nm, H = 2.3 nm and ΔR = 0.35 nm. These results correspond to a model of a Pt-rich core (80% Pt atoms) covered by a shell of about two Co monolayers. The atom number ratio between Pt and Co calculated with this model is in agreement with the ratio obtained by the RBS method over the whole sample or by EDX at the particle scale (NPt/NCo =3).
The combination of AGISAXS and EXAFS analysis, shows that for sequentially deposited Pt@Co NPs, the growth kinetic traps a core–shell structure, with a strained Pt core, even if these two metals have a strong tendency to form an alloy.
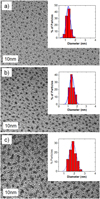 |
Fig. 2 TEM micrographs and size distribution histograms of Co-Pt NPs prepared at 300 K by sequential deposition: (a) initial Pt core only (1.3 × 10¹⁵ atoms/cm2 and 1.2 nm mean size), (b) Pt core then Co (4.0 × 10¹⁵ atoms/cm2 and 1.5 nm mean size) and (c) Pt core then Co (5.5 × 10¹⁵ atoms/cm2 and about 2 nm across). |
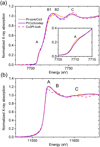 |
Fig. 3 XANES spectra (a) at the Co K edge and (b) at the Pt L3 edge for a sequentially deposited Pt@Co3 (light-orange line) sample, a codeposited PtCo3 sample (dark-violet line) indicating the A, B1, B2 and C features. The XANES spectrum of a Co3Pt alloyed bulk material is shown for comparison (pink dashed line). The inset shows an enlargement of the A shoulder for the two NP samples. |
Number of nearest-neighbors NN (with a standard deviation of 0.5) and interatomic distances R around Co and Pt atoms for (s-index) sequential and (c-index) codeposited NPs (R in Å and σ2 in Å2 with uncertainities of 0.02 Å and 0.002 Å2 respectively) deduced from EXAFS fits.
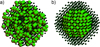 |
Fig. 4 Configurations of the CoPt3 nanoparticle models (a) alloyed and (b) Pt core-Co shell. The Pt and Co atoms are represented by green large spheres and black small spheres, respectively. |
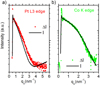 |
Fig. 5 GISAXS one-dimensional qz cuts of Pt@Co sequentially deposited particles in log scale: (a) at Pt L3 edge, (b) at Co K edge. Differential intensity ΔI = I(E1) − I(E2) (symbols) and total intensity I(E1) (solid line) are shown for each graphs. I(E1) and I(E2) are the energies 11461 and 11560 eV and 7606 and 7705 eV at the Pt L3 edge and at Co K edge, respectively. ΔI is normalized with respect to I(E2) to allow a direct comparison. |
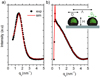 |
Fig. 6 GISAXS measured (symbols) and simulated (solid line) (a) qy in-plane cross-section and (b) qz out-of-plane cross-section of Pt@Co sequentially deposited particle sample. For a better understanding, diameter D, height H and interparticle distance A, and the core diameter Dc in a core–shell structure are shown in the inset. |
3.2 Annealed Pt@Co and Reverse Co@Pt Deposition
In this section, we report the AGISAXS investigation on the morphology changes induced by annealing at low temperature (500 °C) of Pt@Co NPs obtained by sequential deposition. In a similar procedure, the small angle scattering was measured at the vicinity of the Co K edge and the Pt L3 edge as shown in Figure 7. Represented in the “differential mode”, the 1D AGISAXS intensities of the annealed particles (5 × 10¹⁵ atoms/cm2, 3.5 nm) reveal a similar behavior in the I and ΔI profiles at the Pt-edge (Fig. 7) and at Co-edge (not shown). These results are interpreted as a mixing between Co and Pt atoms in the entire particle. For randomly distributed Co and Pt atoms in the particle, all partial scattering factors (Pt-Pt, Co-Pt and Co-Co) should be homothetic and consequently, the intensity profiles exhibit the same shape. This behavior confirms a chemical transition from the core–shell to the alloyed structure when the temperature (500 °C) induces enough atom mobility to achieve the equilibrium alloyed structure. Similar measurements for CoPt co-deposited particles sample (6 × 10¹⁵ atoms/cm2, 2.2nm) show also homothetic profiles (only Pt edge results are shown in Fig. 7b) which confirm the alloying of bimetallic CoPt particles without segregation, as was already demonstrated [20,33]. We have therefore clear evidence of a transition to the alloyed configuration by annealing. The occurence of such transition strengthens certainty about the initial core–shell configuration.
Figure 8 shows the out-of-plane total scattering intensity and the difference ΔI for sequentially deposited particles in a reverse configuration, Co then Pt with a CoPt3 composition. The I and ΔI are significantly different at the Co-edge (Fig. 8b), which reflects the size difference between the entire particle (Co and Pt parts) and the Co part. These results are similar to those described in the Pt@Co configuration. Indeed, if an effect is observed at the core edge, no effect is observed at the shell edge (Pt-edge) (Fig. 8a). These results confirm that the growth kinetics or/and the core structure trap the core–shell structure for sequentially deposited Co-core and Pt-shell at room temperature in an out-of equilibrium configuration. The fitting of these scattering intensity profile gives D = 2.3 nm, H = 1.8 nm and ΔR = 0.4 nm. It corresponds to an average shell thickness of about 2 monolayers of Pt. In the case of core–shell particles, it is worth noting that it is difficult to identify the chemical configuration if the shell thickness is below 2 monolayers, even for two metals with high scattering contrast.
In the previous case of Pt@Co, one argument to explain the stabilization of the Pt-core Co-shell configuration could be an effect of the alumina coverlayer. For Co@Pt configuration, this reason is also relevant. However, the most likely reason appears to be the kinetic trapping which is consistent with the mechanism of limited diffusion observed at low temperature in alloyed CoPt nanoparticle. Indeed, even if the CoPt chemically L1o ordered phase is thermodynamically stable at room temperature [19], CoPt NPs grow generally in the metastable face-centered-cubic (fcc) chemically disordered phase A1. Annealing is then required to promote atomic diffusion and to reach a chemically ordered state [5,10,39]. Among the origins of this behavior, the major obstacles to the order are the tendency of CoPt NPs to grow with multiple twinning, surface segregation (Pt-rich surface layer) or internal strains [21,53,54]. Among these, the two latter effects may also be a source of stability for our core–shell NPs.
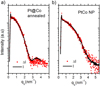 |
Fig. 7 GISAXS one-dimensional qz cuts at the Pt L3 edge of: (a) Pt@Co sequentially deposited particles annealed at 500 °C, (b) PtCo codeposited particles. Normalized differential intensity ΔI = I(E1) – I(E2) (symbols) and total intensity I(E1) (solid line) are shown for each graphs in log scale. |
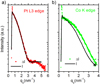 |
Fig. 8 GISAXS one-dimensional qz cuts of reverse Co@Pt sequentially deposited particles: (a) at Pt L3 edge, (b) at Co K edge. Differential intensity ΔI = I(E1) – I(E2) (symbols) and total intensity I(E1) (solid line) are shown for each graphs. I(E1) and I(E2) are at the energies 11 461 and 11 560 eV, and 7606 and 7705 eV at the Pt L3 edge and at Co K edge, respectively. ΔI is normalized with respect to I(E2) to allow a direct comparison. |
4 Conclusion
We have reported here a comprehensive architectural evaluation of the supported Co@Pt and Pt@Co core–shell and alloyed nanoparticles that provides spatially and elementary resolved structural information on NPs with size lower than 4 nm. This comparative study illustrates how anomalous grazing incidence small-angle X-ray scattering (AGISAXS), combined with transmission electron microscopy/energy dispersive spectroscopy (TEM/EDX) analyses provide complementary information used to construct a detailed description of the core–shell and alloy nanostructures. The X-ray absorption spectroscopy measurements are in agreement with the AGISAXS results. We can clearly differentiate NPs of the same size in alloyed or core shell structures with two-monolayers-thick shells. AGISAXS allowed a very detailed view for the two main samples in opposite configurations: Co@Pt sequentially grown nanoparticles led to a Co-core surrounded by a Pt-shell, and Pt@Co sequentially grown nanoparticles led to a non trivial result with the reverse configuration of a Pt-rich core surrounded by a Co shell with a lattice contraction of the core relative to the bulk metal. The former case is in agreement with results on alloyed bulk system surfaces or on larger NPs [15,22], showing that a Pt top-layer may be stabilized. In the latter case, the strained structure present in Pt-core at this size range may contribute to this tendency to kinetically stabilize the core–shell configuration.
These results allow us to claim that the lack of atom mobility at room temperature is the main origin of the stabilization of core–shell structures for NPs obtained by sequential deposition, even for the CoPt system which has a high alloying tendency. The mechanism of kinetic trapping poses an interesting theoretical question. Further investigations of the growth or rather the stability and consenquently ageing of metal nanoalloys is an open direction of research, already explored theoretically in several systems [55–59] but more rarely experimentally due to the need to carry out time resolved investigations. Finite-size phenomena of strain-dependent atom rearrangement is expected to be of major importance for the relative stability of the different cluster structures. Recent in situ and real-time investigations of the structural and morphological evolution during the sequential deposition in ultra high vacuum confirmed the interest of these interpretations and methods [41,60].
We would like to thank our former and present Ph.D. students especially, N. Bouet, for their fruitful preliminary contributions to these works. The authors are grateful to Christine Mottet (CINaM, Marseille, France) for enthusiastic and helpful discussions. Finally, the authors acknowledge ESRF (Grenoble, France) and SOLEIL (Gif-sur-Yvette, France) synchrotron facilities for synchrotron radiation access. We would like to thank Jean-Louis Hazemann and Javier Perez for assistance in using FAME and SWING beamlines, respectively. RBS experiment was done at CEMHTI, Orleans, France. In addition, some of the author would like to acknowledge support from the International Research Network IRN Nanoalloys (CNRS) to facilitate and to coordinate the exchanges on the nanoalloy subject.
Author Contribution Statement
All the authors were involved in the preparation of the manuscript. All the authors have read and approved the final manuscript.
Supplementary Material
The supplementary material gives the details of the EXAFS methodology used in the study for the sequentially deposited Pt@Co3 and PtCo3 codeposited samples. In addition, anomalous X-ray scattering methodology for spectra analysis is explained. Complementary, an example of RBS measurements and analysis about the average composition of the deposited nanoparticles is shown.
The Supplementary Material is available at https://www.epjap.org/0.1051/epjap/2022220027/olm.
References
- R. Ferrando, J. Jellinek, R.L. Johnston, Chem. Rev . 108, 845 (2008) [CrossRef] [PubMed] [Google Scholar]
- D. Alloyeau, C. Mottet, C. Ricolleau, Nanoalloys: Synthesis, Structure and Properties (Springer-Verlag, London, 2012) [CrossRef] [Google Scholar]
- F. Calvo, Nanoalloys: from fundamentals to emerging applications , 2nd edn. (Elsevier, Amsterdam, 2020) [Google Scholar]
- P. Melinon, S. Begin-Colin, J.-L. Duvail, F. Gaure, N. Herlin Boime, G. Ledoux, J. Plain, P. Reiss, F. Silly, B. Warot-Fonrose, Phys. Rep . 543, 163 (2014) [CrossRef] [Google Scholar]
- P. Andreazza, V. Pierron-Bohnes, F. Tournus, C. Andreazza-Vignolle, V. Dupuis, Surf. Sci. Rep . 70, 188 (2015) [CrossRef] [Google Scholar]
- S.S.A. Razee, J.B. Staunton, B. Ginatempo, E. Bruno, F.J. Pinski, Phys. Rev. B 64, 014411 (2001) [CrossRef] [Google Scholar]
- S. Polesya, S. Mankovsky, O. Sipr, W. Meindl, C. Strunk, H. Ebert, Phys. Rev. B 82, 214409 (2010) [CrossRef] [Google Scholar]
- M.E. Gruner, G. Rollmann, P. Entel, M. Farle, Phys. Rev. Lett . 100, 87203 (2008) [CrossRef] [Google Scholar]
- P. Imperia, L. Glaser, M. Martins, P. Andreazza, J. Penuelas, V. Alessandrovic, H. Weller, C. Andreazza-Vignolle, W. Wurth, Phys. Status Solidi A 205, 1047 (2008) [CrossRef] [Google Scholar]
- F. Tournus, A. Tamion, N. Blanc, A. Hannour, L. Bardotti, B. Prevel, P. Ohresser, E. Bonet, T. Epicier, V. Dupuis, Phys. Rev. B 77, 144411 (2008) [CrossRef] [Google Scholar]
- A.I. Figueroa, J. Bartolome, L.M. Garcia, F. Bartolome, O. Bunau, J. Stankiewicz, L. Ruiz, J.M. Gonzalez-Calbet, F. Petroff, C. Deranlot, S. Pascarelli, P. Bencok, N.B. Brookes, F. Wilhelm, A. Smekhova, A. Rogalev, Phys. Rev. B 90, 174421 (2014) [CrossRef] [Google Scholar]
- S.K. Meher, G.R. Rao, J. Phys. Chem. C 117, 4888 (2013) [CrossRef] [Google Scholar]
- C. Koenigsmann, M.E. Scofield, H. Liu, S.S. Wong, J. Phys. Chem. Lett . 3, 3385 (2012) [CrossRef] [Google Scholar]
- X. Zhang, H. Wang, J. Key, V. Linkov, S. Ji, X. Wang, Z. Lei, R. Wang, J. Electrochem. Soc . 159, B270 (2012) [CrossRef] [Google Scholar]
- J.-I. Park, M.G. Kim, Y.-W. Jun, J.S. Lee, W.-R. Lee, J. Cheon, J. Am. Chem. Soc . 126, 9072 (2004) [CrossRef] [PubMed] [Google Scholar]
- D.A. Cantane, F.E.R. Oliveira, S.F. Santos, F.H.B. Lima, Appl. Catal., B 136, 351 (2013) [CrossRef] [Google Scholar]
- D. Wang, H.L. Xin, R. Hovden, H. Wang, Y. Yu, D.A. Muller, F.J. DiSalvo, D. Abrua, Nat. Mater . 12, 81 (2013) [CrossRef] [PubMed] [Google Scholar]
- K. Sato, K. Yanajima, T.J. Konno, Thin Solid Films 520, 3544 (2012) [CrossRef] [Google Scholar]
- G. Rossi, R. Ferrando, C. Mottet, Faraday Discuss . 138, 193 (2008) [CrossRef] [PubMed] [Google Scholar]
- J. Penuelas, C. Andreazza-Vignolle, P. Andreazza, A. Ouerghi, N. Bouet, Surf. Sci . 602, 545 (2008) [CrossRef] [Google Scholar]
- R.V. Chepulskii, W.H. Butler, Phys. Rev. B 86, 155401 (2012) [CrossRef] [Google Scholar]
- J.-Y. Bigot, H. Kesserwan, V. Halt, O. Ersen, M.S. Moldovan, T.H. Kim, J. Jang, J. Cheon, Nano Lett . 12, 1189 (2012) [CrossRef] [PubMed] [Google Scholar]
- N.S. Sobal, U. Ebels, H. Mohwald, M. Giersig, J. Phys. Chem. B 107, 7351 (2003) [CrossRef] [Google Scholar]
- H. Zeng, S. Sun, J. Li, Z.L. Wang, J.P. Liu, Appl. Phys. Lett . 85, 5, 792 (2004) [CrossRef] [Google Scholar]
- A.I. Frenkel, Zeit. Krystall . 222, 605 (2007) [Google Scholar]
- P. Andreazza, in Nanoalloys: Synthesis, Structure and Properties edited by D. Alloyeau, C. Mottet, C. Ricolleau (Springer-Verlag, London, 2012), pp. 69–114 [Google Scholar]
- J.-P. Simon, O. Lyon, in Resonant Anomalous X-ray Scattering , edited by G. Materlick, C.J. Sparks, K. Fischer (Elsevier Science, The Netherlands, 1994), p. 305 [Google Scholar]
- G. Goerigk, H.-G. Haubold, O. Lyon, J.-P. Simon, J. Appl. Crystallogr . 36, 425 (2003) [CrossRef] [Google Scholar]
- A.L. Thomann, P. Brault, J.P. Rozenbaum, C. Andreazza, P. Andreazza, H. Estrade, B. Rousseau, D. Babonneau, G. Blondiaux, J. Phys. D 30, 3197 (1997) [CrossRef] [Google Scholar]
- J. Penuelas, P. Andreazza, C. Andreazza-Vignolle, C. Mottet, M. De Santis, H.C.N. Tolentino, Eur. Phys. J. Special Topics 167, 19 (2009) [CrossRef] [Google Scholar]
- J.-P. Simon, D. Babonneau, M. Drouet, O. Lyon, J. Appl. Crystallogr . 42, 312 (2009) [Google Scholar]
- P. Andreazza, H. Khelfane, O. Lyon, C. Andreazza-Vignolle, A. Ramos, M. Samah, Eur. Phys. J. Special Topics 218, 231 (2012) [CrossRef] [Google Scholar]
- J. Penuelas, P. Andreazza, C. Andreazza-Vignolle, H.C.N. Tolentino, M. De Santis, C. Mottet, Phys. Rev. Lett . 100, 115502 (2008) [CrossRef] [PubMed] [Google Scholar]
- O. Proux, V. Nassif, A. Prat, O. Ulrich, E. Lahera, X. Biquard, J. Menthonnex, J. Hazemann, J. Synchrotron Radiat . 13, 59 (2006) [CrossRef] [PubMed] [Google Scholar]
- J. Haug, H. Kruth, M. Dubiel, H. Hofmeister, S. Haas, D. Tatchev, A. Hoell, Nanotechnology 20, 505705 (2009) [CrossRef] [PubMed] [Google Scholar]
- C. Yu, S. Koh, J.E. Leisch, M.F. Toney, P. Strasser, Faraday Discuss . 140, 283 (2008) [Google Scholar]
- P. Imperia, P. Andreazza, D. Schmitz, J. Penuelas, C. Andreazza-Vignolle, J. Magn. Magn. Mater . 310, 2417 (2007) [CrossRef] [Google Scholar]
- C. Revenant, F. Leroy, R. Lazzari, G. Renaud, C.R. Henry, Phys. Rev. B 69, 035411 (2004) [CrossRef] [Google Scholar]
- P. Andreazza, C. Mottet, C. Andreazza-Vignolle, J. Penuelas, H.C.N. Tolentino M. De Santis, N. Bouet, R. Felici, Phys. Rev. B 82, 155453 (2010) [CrossRef] [Google Scholar]
- F. Leroy, G. Renaud, A. Letoublon, R. Lazzari, Phys. Rev. B 77, 235429 (2008) [CrossRef] [Google Scholar]
- P. Andreazza, A. Lemoine, A. Coati, D. Nelli, R. Ferrando, Y. Garreau, J. Creuze, C. Andreazza-Vignolle, Nanoscale 13, 6096 (2021) [CrossRef] [PubMed] [Google Scholar]
- R. Lazzari, J. Appl. Crystallogr . 35, 406 (2002) [CrossRef] [Google Scholar]
- M. Mougenot, P. Andreazza, C. Andreazza-Vignolle, R. Escalier, Th. Sauvage, O. Lyon, P. Brault, J. Nano. Res . 14, 672 (2012) [CrossRef] [Google Scholar]
- N. Blanc, L.E. Diaz-Sanchez, A.Y. Ramos, F. Tournus, H.C.N. Tolentino, M. De Santis, O. Proux, A. Tamion, J. Tuaillon-Combes, L. Bardotti, O. Boisron, G.M. Pastor, V. Dupuis, Phys. Rev. B 87, 155412 (2013) [CrossRef] [Google Scholar]
- M. Zinke-Allmang, L.C. Feldman, M.H. Grabow, Surf. Sci. Rep . 16, 377 (1992) [CrossRef] [Google Scholar]
- P. Brault, A.-L. Thomann, C. Andreazza-Vignolle, Surf. Sci . 406, L597 (1998) [CrossRef] [Google Scholar]
- W.-F. Huang, Q. Zhang, D.-F. Zhang, J. Zhou, C. Si, L. Guo, W.-S. Chu, Z.-Y. Wu, J. Phys. Chem. C 117, 6872 (2013) [CrossRef] [Google Scholar]
- F.-J. Lai, L.S. Sarma, H.-L. Chou, D.-G. Liu, C.-A. Hsieh, J.-F. Lee, B.-J. Hwang, J. Phys. Chem. C 113, 12674 (2009) [CrossRef] [Google Scholar]
- R.M. Anderson, L. Zhang, J.A. Loussaert, A.I. Frenkel, G. Henkelman, R.M. Crook, ACS Nano 7, 9345 (2013) [CrossRef] [PubMed] [Google Scholar]
- S. Alayoglu, P. Zavalij, B. Eichhorn, Q. Wang, A.I. Frenkel, P. Chupas, ACS Nano 3, 3127 (2009) [CrossRef] [PubMed] [Google Scholar]
- A.I. Frenkel, C.W. Hills, R.G. Nuzzo, J. Phys. Chem. B 105, 12689 (2001) [CrossRef] [Google Scholar]
- V. Dupuis, N. Blanc, L.-E. Diaz-Sanchez, A. Hillion, A. Tamion, F. Tournus, G-M. Pastor, A. Rogalev, F. Wilhelm, Eur. Phys. J. D 67, 25 (2013) [CrossRef] [Google Scholar]
- M.E. Gruner, P. Entel, Inter. J. Quant. Chem . 112, 277 (2012) [CrossRef] [Google Scholar]
- A. Lopes, G. Treglia, C. Mottet, B. Legrand, Phys. Rev. B 91, 035407 (2015) [CrossRef] [Google Scholar]
- F. Baletto, C. Mottet, R. Ferrando, Phys. Rev. Lett . 90, 135504 (2003) [CrossRef] [PubMed] [Google Scholar]
- V. Gorshkov, V. Kuzmenko, V. Privman, J. Phys. Chem. C 118, 24959 (2014) [CrossRef] [Google Scholar]
- F. Berthier, A. Tadjine, B. Legrand, Phys. Chem. Chem. Phys . 17, 28193 (2015) [CrossRef] [PubMed] [Google Scholar]
- D. Nelli, R. Ferrando, Nanoscale 11, 13040 (2019) [CrossRef] [PubMed] [Google Scholar]
- G.D. Forster, M. Benoit, J. Lam, Phys. Chem. Chem. Phys . 21, 22774 (2019) [CrossRef] [PubMed] [Google Scholar]
- P. Andreazza, C. Mottet, H. Khelfane, M. De Santis, C. Andreazza-Vignolle, Phys. Rev. B to be published . [Google Scholar]
Cite this article as: Hocine Khelfane, Caroline Andreazza-Vignolle, Aline Y. Ramos, Jose Penuelas, Thierry Sauvage, and Pascal Andreazza, Out-of-equilibrium supported Pt-Co core–shell nanoparticles stabilized by kinetic trapping at room temperature, Eur. Phys. J. Appl. Phys. 97, 56 (2022)
All Tables
Number of nearest-neighbors NN (with a standard deviation of 0.5) and interatomic distances R around Co and Pt atoms for (s-index) sequential and (c-index) codeposited NPs (R in Å and σ2 in Å2 with uncertainities of 0.02 Å and 0.002 Å2 respectively) deduced from EXAFS fits.
All Figures
|
Fig. 1 (a) Two-dimensional GISAXS patterns of the Pt-Co sample measured near the Pt L3 edge (intensity in log scale). (b) qy and (c) qz one-dimensional cross-sections (qy and qz cuts in (a)) measured at different energies show the anomalous intensity variation in linear scale. |
| In the text | |
|
Fig. 2 TEM micrographs and size distribution histograms of Co-Pt NPs prepared at 300 K by sequential deposition: (a) initial Pt core only (1.3 × 10¹⁵ atoms/cm2 and 1.2 nm mean size), (b) Pt core then Co (4.0 × 10¹⁵ atoms/cm2 and 1.5 nm mean size) and (c) Pt core then Co (5.5 × 10¹⁵ atoms/cm2 and about 2 nm across). |
| In the text | |
|
Fig. 3 XANES spectra (a) at the Co K edge and (b) at the Pt L3 edge for a sequentially deposited Pt@Co3 (light-orange line) sample, a codeposited PtCo3 sample (dark-violet line) indicating the A, B1, B2 and C features. The XANES spectrum of a Co3Pt alloyed bulk material is shown for comparison (pink dashed line). The inset shows an enlargement of the A shoulder for the two NP samples. |
| In the text | |
|
Fig. 4 Configurations of the CoPt3 nanoparticle models (a) alloyed and (b) Pt core-Co shell. The Pt and Co atoms are represented by green large spheres and black small spheres, respectively. |
| In the text | |
|
Fig. 5 GISAXS one-dimensional qz cuts of Pt@Co sequentially deposited particles in log scale: (a) at Pt L3 edge, (b) at Co K edge. Differential intensity ΔI = I(E1) − I(E2) (symbols) and total intensity I(E1) (solid line) are shown for each graphs. I(E1) and I(E2) are the energies 11461 and 11560 eV and 7606 and 7705 eV at the Pt L3 edge and at Co K edge, respectively. ΔI is normalized with respect to I(E2) to allow a direct comparison. |
| In the text | |
|
Fig. 6 GISAXS measured (symbols) and simulated (solid line) (a) qy in-plane cross-section and (b) qz out-of-plane cross-section of Pt@Co sequentially deposited particle sample. For a better understanding, diameter D, height H and interparticle distance A, and the core diameter Dc in a core–shell structure are shown in the inset. |
| In the text | |
|
Fig. 7 GISAXS one-dimensional qz cuts at the Pt L3 edge of: (a) Pt@Co sequentially deposited particles annealed at 500 °C, (b) PtCo codeposited particles. Normalized differential intensity ΔI = I(E1) – I(E2) (symbols) and total intensity I(E1) (solid line) are shown for each graphs in log scale. |
| In the text | |
|
Fig. 8 GISAXS one-dimensional qz cuts of reverse Co@Pt sequentially deposited particles: (a) at Pt L3 edge, (b) at Co K edge. Differential intensity ΔI = I(E1) – I(E2) (symbols) and total intensity I(E1) (solid line) are shown for each graphs. I(E1) and I(E2) are at the energies 11 461 and 11 560 eV, and 7606 and 7705 eV at the Pt L3 edge and at Co K edge, respectively. ΔI is normalized with respect to I(E2) to allow a direct comparison. |
| In the text | |
Current usage metrics show cumulative count of Article Views (full-text article views including HTML views, PDF and ePub downloads, according to the available data) and Abstracts Views on Vision4Press platform.
Data correspond to usage on the plateform after 2015. The current usage metrics is available 48-96 hours after online publication and is updated daily on week days.
Initial download of the metrics may take a while.