Fig. 6
Download original image
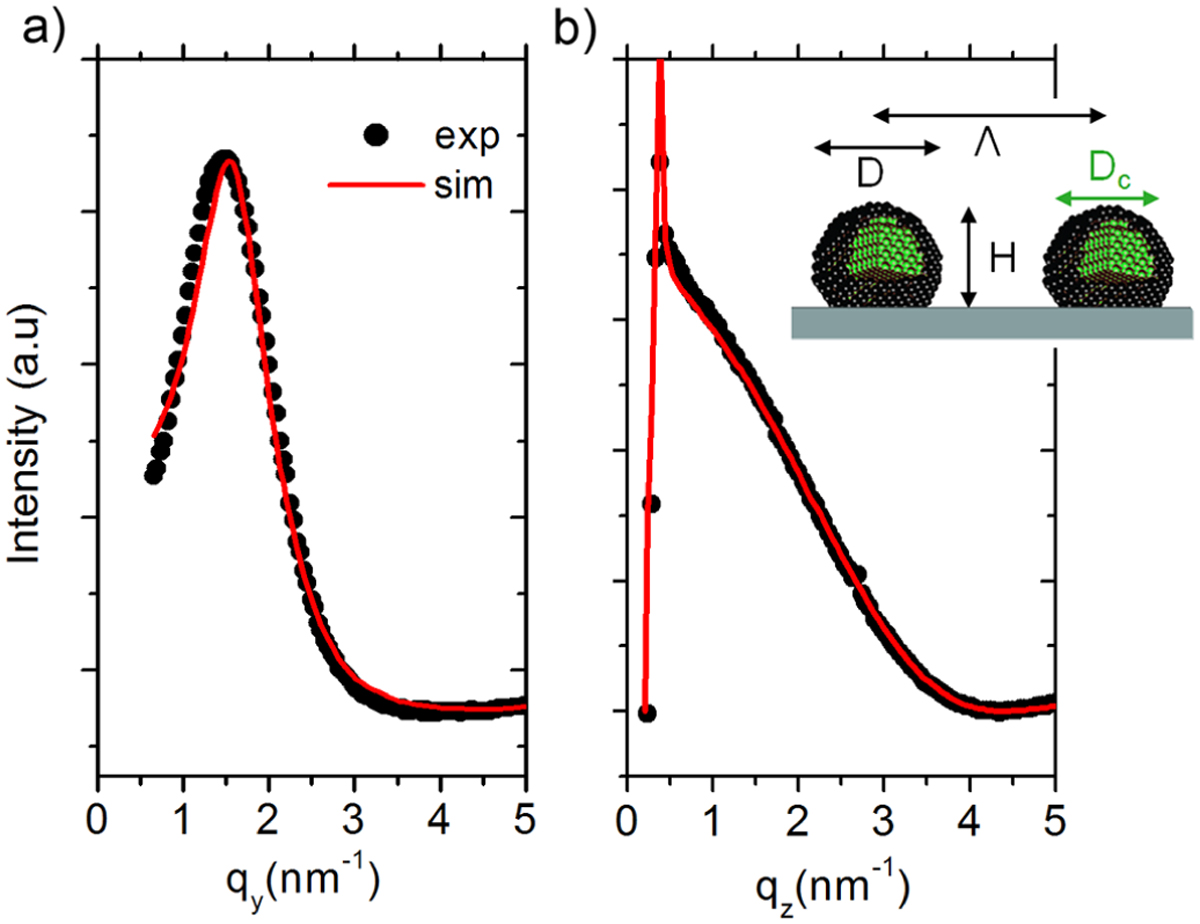
GISAXS measured (symbols) and simulated (solid line) (a) qy in-plane cross-section and (b) qz out-of-plane cross-section of Pt@Co sequentially deposited particle sample. For a better understanding, diameter D, height H and interparticle distance A, and the core diameter Dc in a core–shell structure are shown in the inset.
Current usage metrics show cumulative count of Article Views (full-text article views including HTML views, PDF and ePub downloads, according to the available data) and Abstracts Views on Vision4Press platform.
Data correspond to usage on the plateform after 2015. The current usage metrics is available 48-96 hours after online publication and is updated daily on week days.
Initial download of the metrics may take a while.