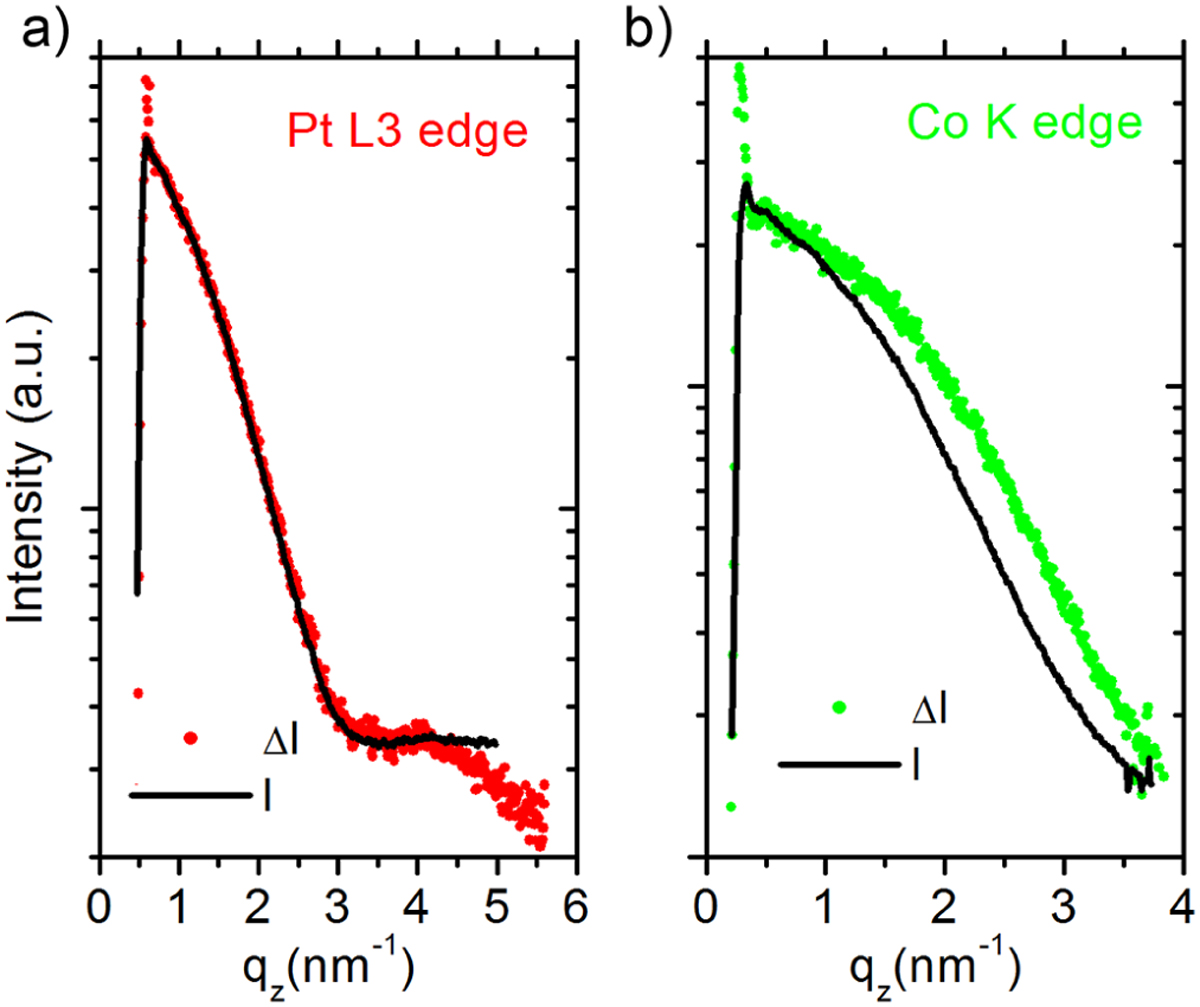
Fig. 8
Download original image
GISAXS one-dimensional qz cuts of reverse Co@Pt sequentially deposited particles: (a) at Pt L3 edge, (b) at Co K edge. Differential intensity ΔI = I(E1) – I(E2) (symbols) and total intensity I(E1) (solid line) are shown for each graphs. I(E1) and I(E2) are at the energies 11 461 and 11 560 eV, and 7606 and 7705 eV at the Pt L3 edge and at Co K edge, respectively. ΔI is normalized with respect to I(E2) to allow a direct comparison.
Current usage metrics show cumulative count of Article Views (full-text article views including HTML views, PDF and ePub downloads, according to the available data) and Abstracts Views on Vision4Press platform.
Data correspond to usage on the plateform after 2015. The current usage metrics is available 48-96 hours after online publication and is updated daily on week days.
Initial download of the metrics may take a while.