Fig. 3
Download original image
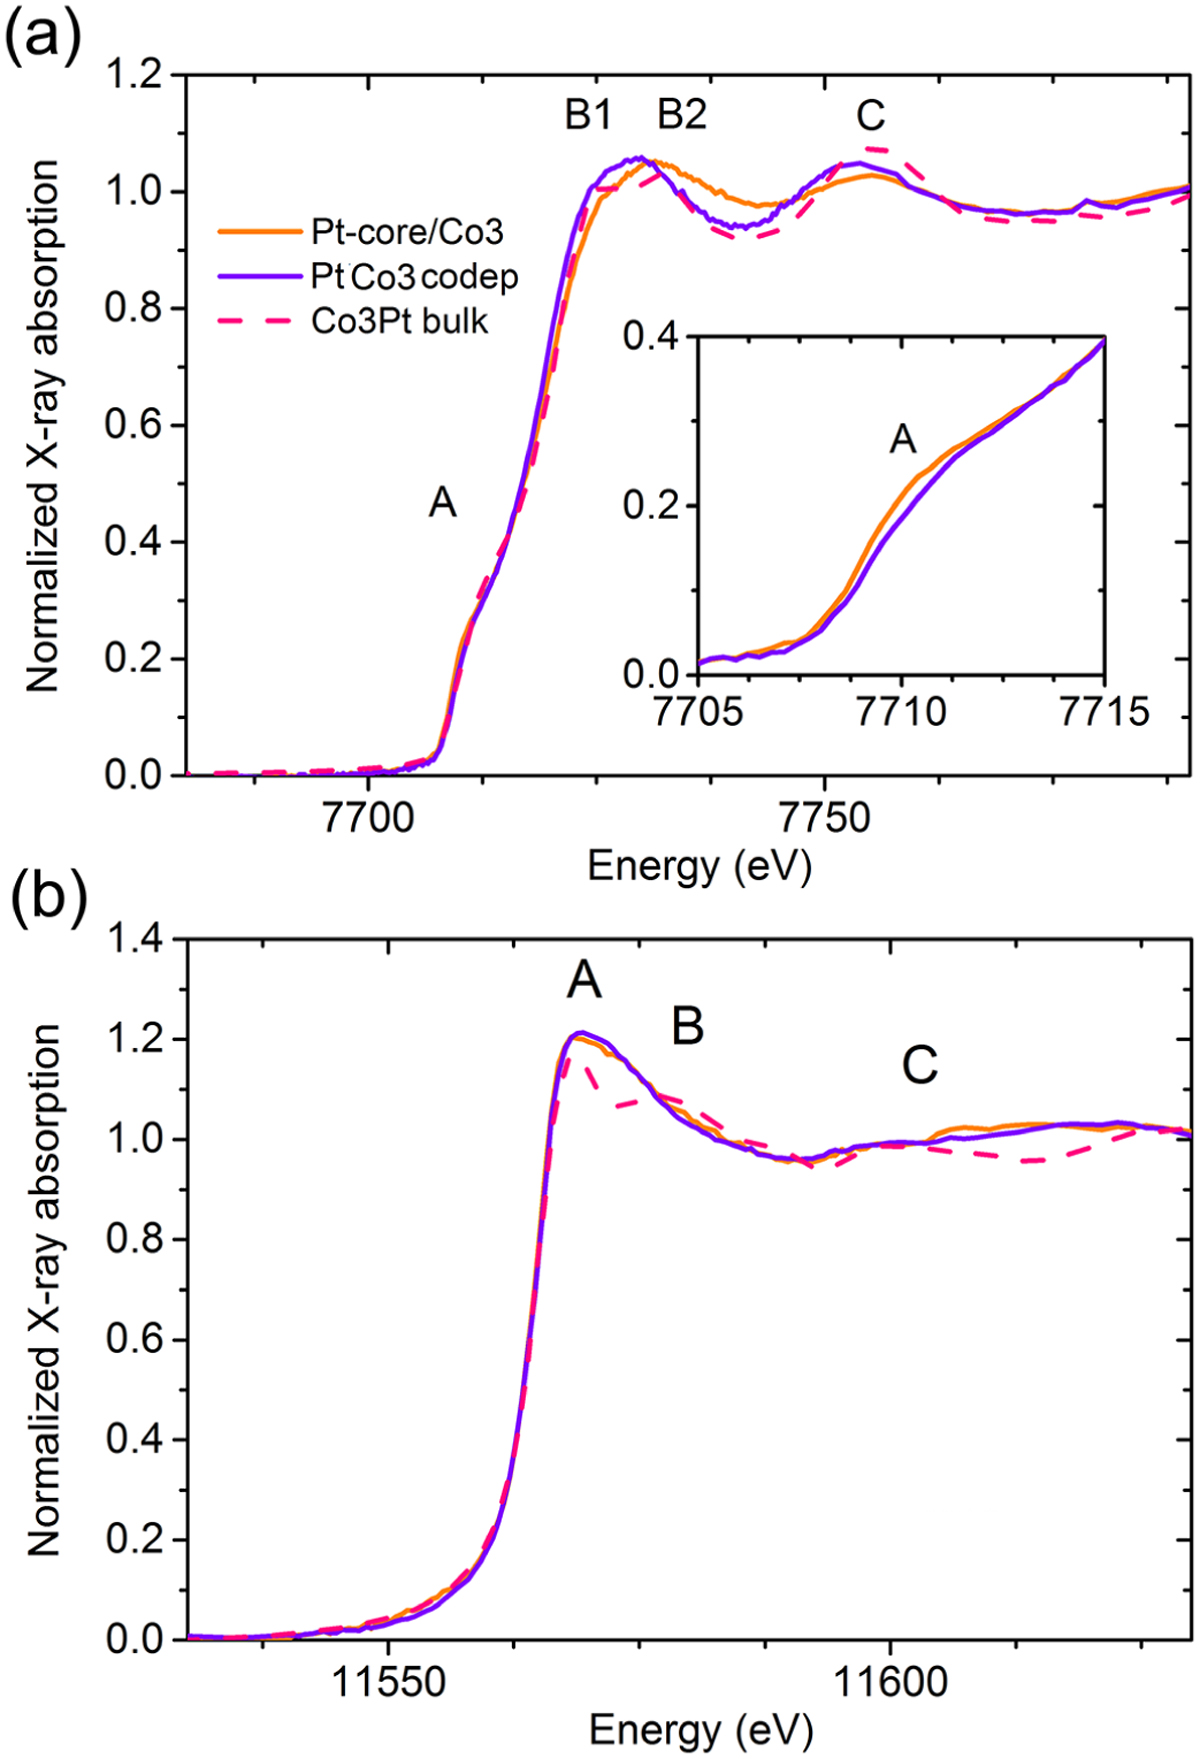
XANES spectra (a) at the Co K edge and (b) at the Pt L3 edge for a sequentially deposited Pt@Co3 (light-orange line) sample, a codeposited PtCo3 sample (dark-violet line) indicating the A, B1, B2 and C features. The XANES spectrum of a Co3Pt alloyed bulk material is shown for comparison (pink dashed line). The inset shows an enlargement of the A shoulder for the two NP samples.
Current usage metrics show cumulative count of Article Views (full-text article views including HTML views, PDF and ePub downloads, according to the available data) and Abstracts Views on Vision4Press platform.
Data correspond to usage on the plateform after 2015. The current usage metrics is available 48-96 hours after online publication and is updated daily on week days.
Initial download of the metrics may take a while.