Fig. 1
Download original image
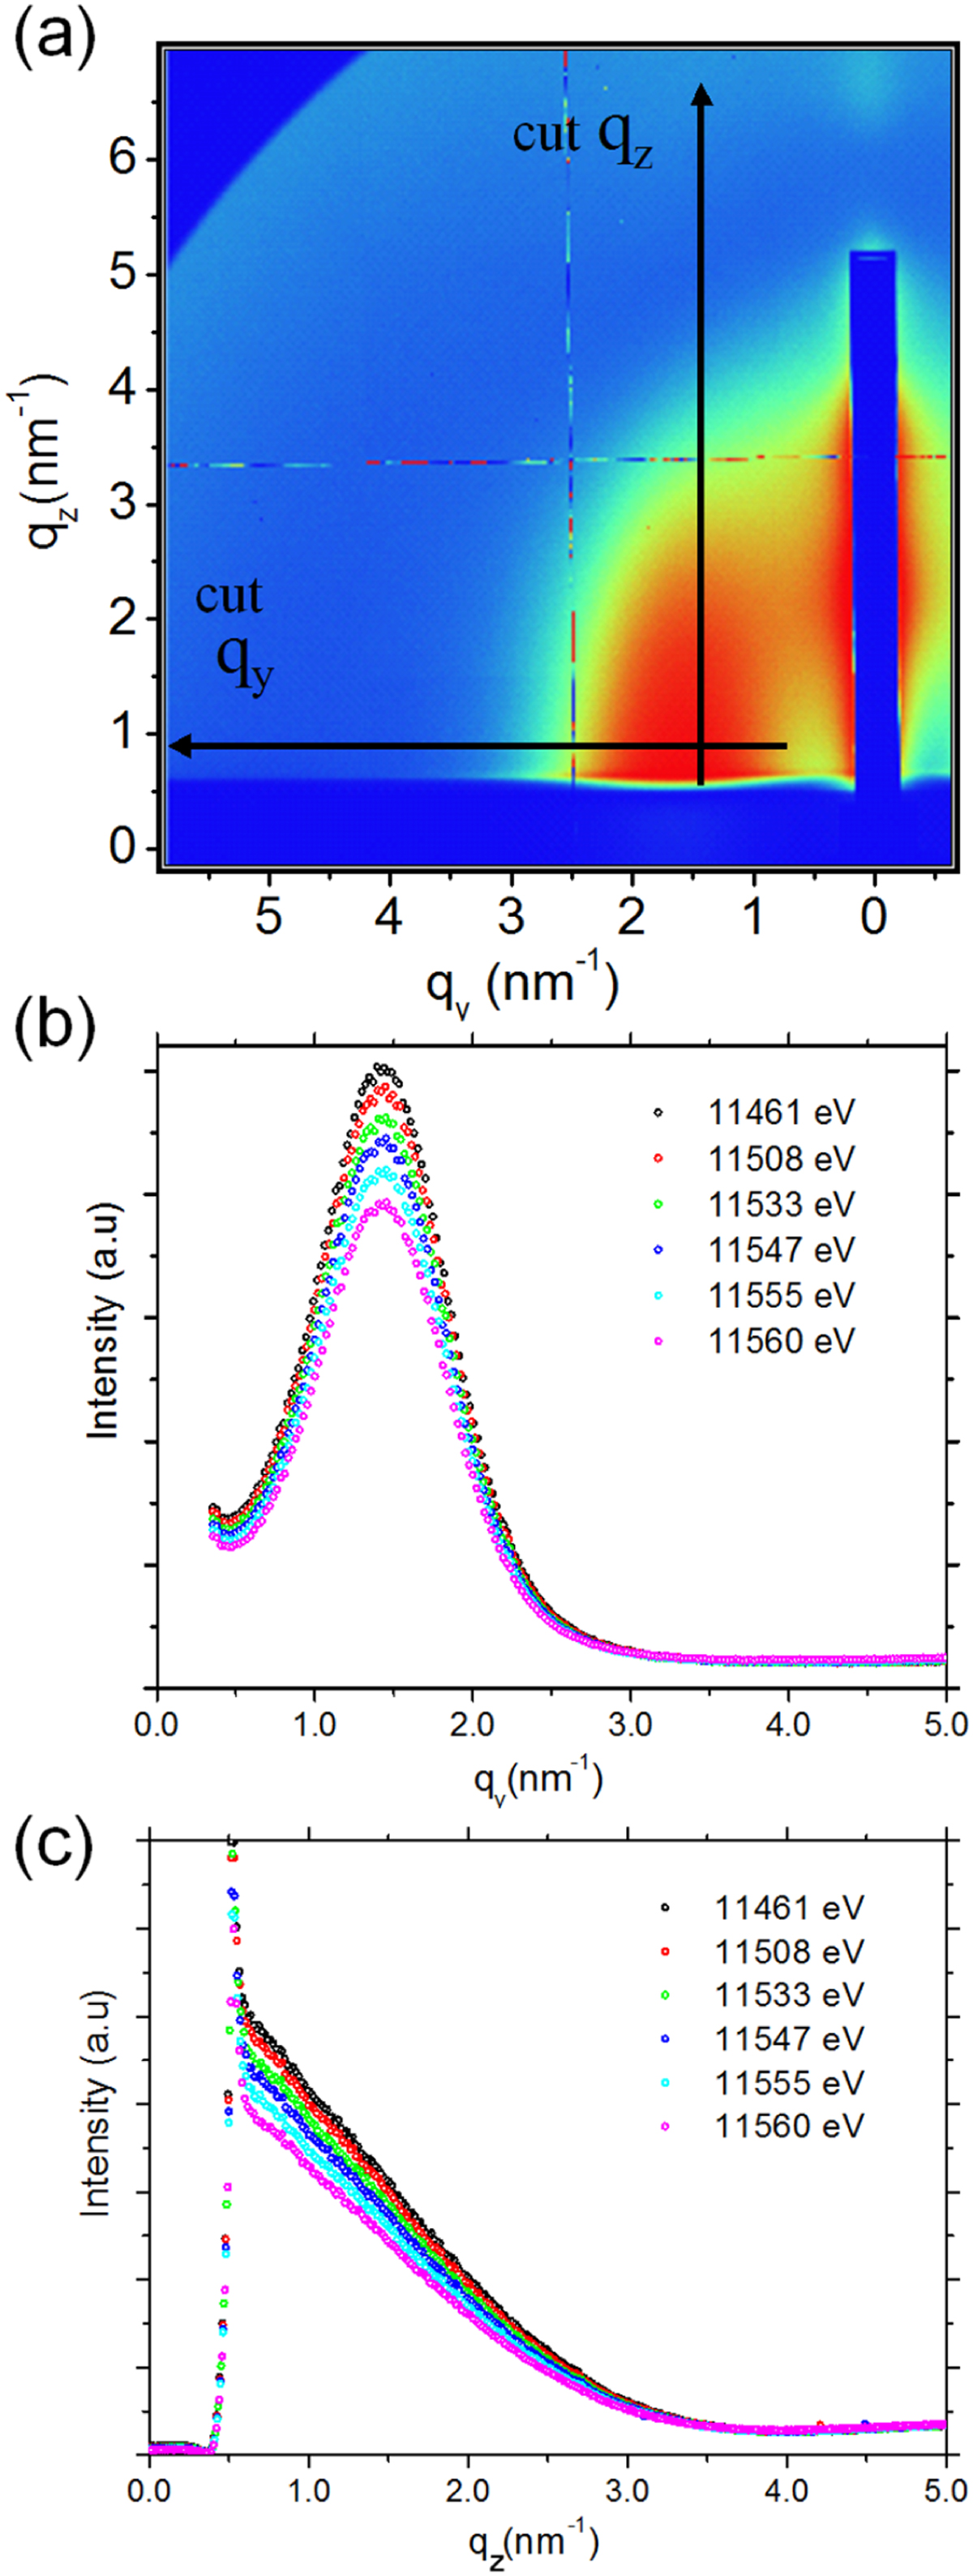
(a) Two-dimensional GISAXS patterns of the Pt-Co sample measured near the Pt L3 edge (intensity in log scale). (b) qy and (c) qz one-dimensional cross-sections (qy and qz cuts in (a)) measured at different energies show the anomalous intensity variation in linear scale.
Current usage metrics show cumulative count of Article Views (full-text article views including HTML views, PDF and ePub downloads, according to the available data) and Abstracts Views on Vision4Press platform.
Data correspond to usage on the plateform after 2015. The current usage metrics is available 48-96 hours after online publication and is updated daily on week days.
Initial download of the metrics may take a while.