| Issue |
Eur. Phys. J. Appl. Phys.
Volume 100, 2025
|
|
|---|---|---|
| Article Number | 12 | |
| Number of page(s) | 5 | |
| DOI | https://doi.org/10.1051/epjap/2025012 | |
| Published online | 06 May 2025 | |
https://doi.org/10.1051/epjap/2025012
Short Communication
Conventional and high power impulse magnetron sputtering deposition of tantalum nitride films: a molecular dynamics approach
1
MS4ALL, 1 avenue du Champ de Mars, 45100 Orléans, France
2
GREMI, CNRS, Université d'Orléans, 14 rue d'Issoudun, 45067 Orléans, France
3
Safran Tech, rue des jeunes bois, Châteaufort, CS 80112, 78772 Magny-les-Hameaux, France
* e-mail: This email address is being protected from spambots. You need JavaScript enabled to view it.
** e-mail: This email address is being protected from spambots. You need JavaScript enabled to view it.
Received:
10
January
2025
Accepted:
10
April
2025
Published online: 6 May 2025
Abstract
For understanding and controlling film growth parameters of various sputtering deposition conditions, molecular dynamics simulations are carried out to describe Tantalum Nitride conventional Magnetron Sputtering and High Power Impulse Magnetron Sputtering (HiPIMS) film growth and structure. It includes full atomic and ion energy distribution for a realistic account of experimental conditions, notably for HiPIMS deposition technique. Results are well compared with available experimental results in the literature, demonstrating that the present method is well suited for a very broad set of experimental conditions. The effect of the sputtered ion to neutral ratio on the film crystallographic structure is addressed using simulated X-ray diffraction and polyhedral template matching methods. It is shown that hcp phase predominates at moderate ion flux, and always coexists with fcc phase. The present molecular dynamics simulations, are therefore a powerful tool for correlating the predicted thin film structure to experimental conditions.
Key words: Molecular dynamics simulations / HiPIMS / sputtering deposition / thin films / nitride
© P. Brault et al., Published by EDP Sciences, 2025
 This is an Open Access article distributed under the terms of the Creative Commons Attribution License https://creativecommons.org/licenses/by/4.0 which permits unrestricted use, distribution, and reproduction in any medium, provided the original work is properly cited.
1 Introduction
Transition metal nitrides have garnered significant interest due to their remarkable chemical and physical properties [1]. Among these, tantalum nitride (TaN) has emerged as a material of choice for a wide range of applications, owing to its desirable characteristics such as low electrical resistivity, high hardness, and excellent thermal stability. TaN is notable for its uniform resistivity, low temperature and voltage coefficients of resistivity, high thermal stability, and its role as an effective barrier material in copper interconnects. It also offers the advantage of its high melting point. Recently, TaN films were successfully used in electrochemical devices [2,3], in electrocatalysis [4] and photocatalysis [5]. Tantalum nitride thin films also find applications in magnetic multilayers and thin-film resistors [6].
Chemically inert, tantalum nitride (Ta–N) exists in various phases, including Ta2N, Ta3N5, Ta5N6, and other metastable configurations. Among these, Ta3N5 is distinguished by its exceptional electrical properties, making it a preferred choice as a dielectric layer in semiconductor devices. In contrast, Ta2N exhibits exhibits metallic-like resistivity. Typically, Ta–N phases such as θ-TaN, Ta5N6, β-Ta2N, η-TaN, δ-TaN1-x, Ta3N5, and Ta4N5 are utilised depending on the application requirements [3,7]. Recently there have been efforts to grow high-quality TaN films using radio-frequency or dc magnetron sputtering (MS) deposition [8], and especially the high power impulse magnetron sputtering (HiPIMS) [3]. Such experiments were conducted at different argon/nitrogen flux ratios, operating pressures, leading to various structures and phases, in addition to targeted functional properties. On the other hand simulations at the atomic level, especially the molecular dynamics simulation technique have made progress and are now able to give insights into magnetron sputtering growth phenomena and resulting atomic structure for direct comparison with experiments. Especially, accounting for the ion and atomic energy distribution (AED and IED) functions allows to get closer to experimental deposition conditions [9]: initial velocities of all depositing species at the substrate. The interest of High Power Impulse Magnetron Sputtering (HiPIMS) operation is to produce sputtered ions that participate to the film growth. An important parameter, though not always determined, is the sputtered ion to neutral ratio, which can reach up to 90% [10–12]. This short communication aims at studying TaN deposition in MS and HiPIMS modes and comparing resulting atomic structures for two different ion-to-neutral ratio.
2 Material and methods
The molecular dynamics simulations consist in solving Newton's equations of motion:
 (1)
(1)
where  is the position of atom i at time t with mass mi, and V is the interaction potential between all N involved species. This equation requires the knowledge of two initial conditions: positions and velocities at the initial time t = 0, and the forces between all species at each instant. Initial positions refer to the geometry/topology of the particles at the beginning of the simulation. Velocities are selected (randomly) from a velocity distribution consistent with the studied phenomena, e.g. selected from a Maxwell-Boltzmann distribution, or from any relevant velocity distribution obtained experimentally (e.g. from mass spectrometry), or from any other dedicated simulations.
The simulation box is an iron substrate with an empty zone above it, from which the incident species, N, N+, Ta and Ta+, are injected, as described in Figure 1.
The iron substrate is of size 20 × 20 × 16  (Fe), with a0(Fe) = 0.287 nm, the lattice parameter of bcc Fe at 300 K. The species are randomly selected according to targeted composition, and injected in sets of 10, at least separated by 1 nm, from a height of 1.5 nm above the substrate. Each set is injected after 20000 timesteps at a height of 0.5 nm above the previous one. Between 20000 and 40000 species are injected per run. After the last injection, a relaxation run is applied during 500000 timesteps. The integration time (one timestep) dt = 0.1 fs. Interaction potentials appearing in Equation (1) are described by Morse functions [13]:
 (2)
(2)
where V is a pair potential energy function, rij is the distance between atoms i and j, r0 is the nearest atomic distance at equilibrium, D is the bond energy and ɑ is the potential stiffness. Cross-interaction parameters are calculated using the Lorentz-Berthelot mixing rules via the following equations [14,15].
 (3)
(3)
All Morse parameters used in this research are listed in Table 1.
It should be noted, use of embedded atom method (EAM) [16] many-body potentials for Fe(Fe+)-Fe(Fe+), Ta(Ta+)-Ta(Ta+) and Fe(Fe+)-Ta(Ta+) interactions does not improve the results.
The next step is to include an energy distribution function for each atom (ion) type. First, ions are treated as fast neutral as they are neutralised at the substrate surface [17]. For the MS process, only Ta and N species are considered. N species are considered instead of N2 since N2 should dissociate for reacting with the surface and then growing film. N AED is defined by a thermal distribution at 300 K. On the other hand, Ta AED [9], issued from SRIM calculation, is propagated through the gas phase at pressure P = 0.5 Pa, along the target to substrate distance d = 7 cm [3]. For HiPIMS process, Ta, Ta+, N, N+ are considered. AED of Ta an N are the same as those used for MS. For Ta+ a bi-Maxwellian IED [18] is considered. Hecimovic et al. [18] demonstrated that, within a certain pressure range, the bi-Maxwellian IED approximation is valid. This IED is defined as:
 (4)
(4)
kBT1,2 are the peak energies of the low- and high-energy Maxwellian IEDs. The lower one (T1) corresponds to thermalised ions accelerated in the sheath. A typical value is 0.35 eV. For the highest energy, T2, a 10 times larger value is retained [18]. C1,2 are fitting parameter. A ratio of C1/C2 = 0.5 is chosen accordingly to previous works [9,18]. Finally, N+ ions are expected to have a constant energy corresponding to the potential drop at the substrate. A typical value of 6 eV is applied here. Figure 2 summarises the selected AED and IED distributions.
The  is fixed to 40 atomic %, for ensuring high enough nitride composition, and
  takes values of 0.9 (high ion flux) and 0.25 (moderate flux).
Such shapes of IED and AED, being typical of the chosen deposition process, allow to run simulations matching as close as possible experimental deposition conditions. Simulations were performed using the LAMMPS software [19,20]. X-ray diffraction patterns were calculated using the Debye method included in LAMMPS [21]. Snapshots were generated using OVITO software [22,23]. The crystalline phases of the simulated films were identified using the Polyhedral Template Matching (PTM) method [24] implemented in OVITO.
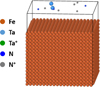 |
Fig. 1 Simulation box used for the calculation. The first set of atoms to be injected is present on the diagram. |
Morse interaction potential parameters for the Fe-Ta (Ta+)-N(N+).
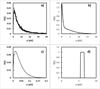 |
Fig. 2 Plots of the AED and IED a) Ta, b) Ta+, c) N, d) N+. Both plot energy and magnitude scales are different, for better view of the A,I-ED shapes. |
3 Results and discussion
Figure 3 displays the final film structures for MS and 2 HiPIMS (moderate and high ion flux) processes. The snapshots show ordered films which have respectively N/Ta ratios of 19%, 6%, and 11% for MS / moderate / high Ta+ ion flux. Moreover the highest ion flux leads to a thinner film compared to the other process. Additionally, the highest Ta+ ion flux leads to greater Ta and N species diffusion in the substrate (Figs 3d-3f). This condition also induces a flatter film surface. These results are in agreement with established experimental and numerical findings [9–11,25,26].
Identified crystallographic phases using PTM method are reported in Table 2.
Table 2 shows that MS deposition results in the highest degree of disorder while fcc phase dominates hcp ones. Using HiPIMS process leads to a reduction of disorder, while for moderate ion flux fcc phase predominates and for high ion flux hcp is the main phase. In this two latter cases, disorder is reduced compared to MS.
For deeper insights of phase identification, x-ray diffraction (XRD) patterns and radial distribution functions (RDF) are calculated and reported in Figure 4. The XRD patterns are very complex. Comparison with Material Projects database (mp-xxxx sheets) [27,28] allows to observe 3 TaN hcp possible structures, including ε-TaN (mp-1279) and mp-1459, mp-1642. These three hcp phases have been considered since they have the lowest formation energy. The fcc δ-TaN phase is also present as well as Ta2N trigonal structure. There is no peak in the range 2θ = 45–60°. This suggests that fcc δ-TaN phase is present since it lqo has no peak in this region. One should note that bcc-Ta is not present since it would have a peak in this region. Other regions 30–45° and 60–80° present peaks of all other expected phases. RDF plots (Figs 4e-4g) provides the positions of the nearest neighbours. The first peak at 2.05 Å corresponds to TaN in ε-TaN. This peak is a bit broad and could include the 2.2 Å distance corresponding to TaN separation in δ-TaN. In the two phases ε- and δ-TaN, Ta-Ta separation are respectively 2.91 and 4.44 Å being the second and fourth peaks in the calculated RDF.
Such results are in agreement with experimental findings [3,26] for which both fcc and hcp phases are obtained using radiofrequency, dc MS and HiPIMS processes.
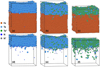 |
Fig. 3 Snapshots of the deposited films: a) MS (Ta and incoming species), b) HiPIMS moderate ion flux, c) HiPIMS high ion flux and the same without the substrate for observing the diffusion of incoming species, d) MS (Ta and incoming species), e) HiPIMS moderate ion flux, f) HiPIMS high ion flux. |
Crystallographic phases of the three films determined by polyhedral template matching method.
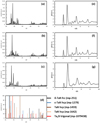 |
Fig. 4 Plots of the simulated XRD a) MS, b) HiPIMS moderate ion flux, c) HiPIMS high ion flux films, d) predicted diffraction peak positions and RDF g(r), e) MS, f) HiPIMS moderate ion flux, g) HiPIMS high ion flux films. |
4 Conclusion
Molecular Dynamics simulation of TaN deposition from conventional MS and HiPIMS has been carried out. Realistic initial velocity conditions of incoming species at the substrate are used for all species. A bi-maxwellian velocity distribution was applied for describing Ta+ incoming ions. Comparing moderate and high flux results in tuning fcc/hcp structure balance. While conventional MS deposition favours fcc structure growth, HiPIMS deposition favors hcp structure. Such balance is in agreement with experimental results. This then allows the method to be applied for any other kind of deposition method, provided AED and IED are known.
Funding
The article processing charges (APC) were funded by Centre National de la Recherche Scientifique.
Conflicts of interest
The authors declare no conflicts of interest in relation to this article.
Data availability statement
The datasets generated during and/or analysed during the current study are available from the corresponding author on reasonable request.
Author contribution statement
Conceptualisation, P.B. and M.C.W.; Methodology, P.B. and M.C.W., Validation, P.B. and M.C.W., S.F. and N.F.; Formal analysis, P.B. and M.C.W.; Investigation, P.B. and M.C.W.; Data Curation, P.B. and M.C.W.; Writing − Original Draft Preparation, P.B.; Writing − Review & Editing, P.B., M.C.W., S.F. and N.F.; Project Administration, M.C.W. and N.F.
References
- R.S. Ningthoujam, N.S. Gajbhiye, Synthesis, electron transport properties of transition metal nitrides and applications, Prog. Mater. Sci. 70, 50 (2015) [CrossRef] [Google Scholar]
- H. Wang, J. Li, K. Li, Y. Lin, J. Chen, L. Gao, V. Nicolosi, X. Xiao, J.-M. Lee, Transition metal nitrides for electrochemical energy applications, Chem. Soc. Rev. 50, 1354 (2021) [CrossRef] [PubMed] [Google Scholar]
- A. Achille, F. Mauvy, S. Fourcade, D. Michau, M. Cavarroc, A. Poulon-Quintin, Electrochemical behavior of tantalum nitride protective layers for PEMFC application, Energies 17, 5099 (2024) [CrossRef] [Google Scholar]
- Z.-G. Yang, H.-M. Xu, T.-Y. Shuai, Q.-N. Zhan, Z.-J. Zhang, K. Huang, C. Dai, G. Li, Recent progress in the synthesis of transition metal nitride catalysts and their applications in electrocatalysis, Nanoscale 15, 11777 (2023) [CrossRef] [PubMed] [Google Scholar]
- Z. Cheng, W. Qi, C.H. Pang, T. Thomas, T. Wu, S. Liu, M. Yang, Recent advances in transition metal nitride-based materials for photocatalytic applications, Adv. Funct. Mater. 31, 2100553 (2021) [CrossRef] [Google Scholar]
- J.L. Qi, L.P. Wang, Y. Zhang, X. Guo, W.Q. Yu, Q.H. Wang, K. Zhang, P. Ren, M. Wen, Amorphous AlN nanolayer thickness dependent toughness, thermal stability and oxidation resistance in TaN/AlN nanomultilayer films, Surf. Coat. Technol. 405, 126724 (2021) [CrossRef] [Google Scholar]
- S. Tsukimoto, M. Moriyama, M. Murakami, Microstructure of amorphous tantalum nitride thin films, Thin Solid Films 460, 222 (2004) [CrossRef] [Google Scholar]
- M. Alishahi, F. Mahboubi, S.M. Mousavi Khoie, M. Aparicio, E. López-Elvira, J. Méndez, R. Gago, Structural properties and corrosion resistance of tantalum nitride coatings produced by reactive DC magnetron sputtering, RSC Adv. 6, 89061 (2016) [CrossRef] [Google Scholar]
- S. Atmane, A. Maroussiak, A. Caillard, A.-L. Thomann, M. Kateb, J.T. Gudmundsson, P. Brault, Role of sputtered atom and ion energy distribution in films deposited by physical vapor deposition: A molecular dynamics approach, J. Vac. Sci. Technol. A 42, 060401 (2024) [CrossRef] [PubMed] [Google Scholar]
- M. Kateb, H. Hajihoseini, J.T. Gudmundsson, S. Ingvarsson, Role of ionization fraction on the surface roughness, density, and interface mixing of the films deposited by thermal evaporation, DC magnetron sputtering, and HiPIMS: An atomistic simulation, J. Vac. Sci. Technol. A 37, 031306 (2019) [CrossRef] [Google Scholar]
- D. Lundin, T. Minea, J.T. Gudmundsson, High power impulse magnetron sputtering: Fundamentals, technologies, challenges and applications (Elsevier, 2019) [Google Scholar]
- J. Fischer, M. Renner, J.T. Gudmundsson, M. Rudolph, H. Hajihoseini, N. Brenning, D. Lundin, Insights into the copper HiPIMS discharge: Deposition rate and ionised flux fraction, Plasma Sources Sci. Technol. 32, 125006 (2023) [CrossRef] [Google Scholar]
- S. Amaya-Roncancio, D.F. Arias-Mateus, M.M. Gómez-Hermida, J.C. Riaño-Rojas, E. Restrepo-Parra, Molecular dynamics simulations of the temperature effect in the hardness on Cr and CrN films, Appl. Surf. Sci. 258, 4473 (2012) [CrossRef] [Google Scholar]
- S.S. Firouzabadi, K. Dehghani, M. Naderi, F. Mahboubi, Numerical investigation of sputtering power effect on nano-tribological properties of tantalum-nitride film using molecular dynamics simulation, Appl. Surf. Sci. 367, 197 (2016) [CrossRef] [Google Scholar]
- M. Nikravesh, G.H. Akbari, A. Poladi, A comprehensive study on the surface tribology of Ta thin film using molecular dynamics simulation: The effect of TaN interlayer, power and temperature, Tribol. Int. 105, 185 (2017) [CrossRef] [Google Scholar]
- X.W. Zhou, R.A. Johnson, H.N.G. Wadley, Misfit-energy-increasing dislocations in vapor-deposited CoFe/NiFe multilayers, Phys. Rev. B 69, 144113 (2004) [Google Scholar]
- P. Brault, A.-L. Thomann, M. Cavarroc, Theory and molecular simulations of plasma sputtering, transport and deposition processes, Eur. Phys. J. D 77, 19 (2023) [CrossRef] [Google Scholar]
- A. Hecimovic, K. Burcalova, A.P. Ehiasarian, Origins of ion energy distribution function (IEDF) in high power impulse magnetron sputtering (HiPIMS) plasma discharge, J. Phys. D: Appl. Phys. 41, 035204 (2008) [Google Scholar]
- A.P. Thompson, H.M. Aktulga, R. Berger, D.S. Bolintineanu, W.M. Brown, P.S. Crozier, P.J. in 't Veld, A. Kohlmeyer, S.G. Moore, T.D. Nguyen, R. Shan, M.J. Stevens, J. Tranchida, C. Trott, S.J. Plimpton, LAMMPS − a flexible simulation tool for particle-based materials modeling at the atomic, meso, and continuum scales, Comput. Phys. Commun. 271, 108171 (2022) [CrossRef] [Google Scholar]
- LAMMPS software homepage (2023). Available at: https://www.lammps.org [Google Scholar]
- S.P. Coleman, D.E. Spearot, L. Capolungo, Virtual diffraction analysis of Ni [010] symmetric tilt grain boundaries, Model. Simul. Mater. Sci. Eng. 21, 055020 (2013) [CrossRef] [Google Scholar]
- A. Stukowski, Visualization and analysis of atomistic simulation data with OVITO − The Open Visualization Tool, Model. Simul. Mater. Sci. Eng. 18, 015012 (2009) [Google Scholar]
- OVITO software homepage. Available at: https://www.ovito.org [Google Scholar]
- P.M. Larsen, S. Schmidt, J. Schiøtz, Robust structural identification via polyhedral template matching, Model. Simul. Mater. Sci. Eng. 24, 055007 (2016) [CrossRef] [Google Scholar]
- J.T. Gudmundsson, Ionization mechanism in the high power impulse magnetron sputtering (HiPIMS) discharge, J. Phys.: Conf. Ser. 100, 082013 (2008) [CrossRef] [Google Scholar]
- C.M. Koller, H. Marihart, H. Bolvardi, S. Kolozsvári, P.H. Mayrhofer, Structure, phase evolution, and mechanical properties of DC, pulsed DC, and high power impulse magnetron sputtered Ta-N films, Surf. Coat. Technol. 347, 304 (2018) [CrossRef] [Google Scholar]
- A. Jain, S.P. Ong, G. Hautier, W. Chen, W.D. Richards, S. Dacek, S. Cholia, D. Gunter, D. Skinner, G. Ceder, K.A. Persson, Commentary: The Materials Project: A materials genome approach to accelerating materials innovation, APL Mater. 1, 011002 (2013) [CrossRef] [Google Scholar]
- Materials Project software homepage. Available at: https://next-gen.materialsproject.org [Google Scholar]
Cite this article as: Pascal Brault, Marjorie Cavarroc-Weimer, Sara Fazeli, Nicolas Froloff, Conventional and high power impulse magnetron sputtering deposition of tantalum nitride films: a molecular dynamics approach, Eur. Phys. J. Appl. Phys. 100, 12 (2025), https://doi.org/10.1051/epjap/2025012
All Tables
Crystallographic phases of the three films determined by polyhedral template matching method.
All Figures
|
Fig. 1 Simulation box used for the calculation. The first set of atoms to be injected is present on the diagram. |
| In the text | |
|
Fig. 2 Plots of the AED and IED a) Ta, b) Ta+, c) N, d) N+. Both plot energy and magnitude scales are different, for better view of the A,I-ED shapes. |
| In the text | |
|
Fig. 3 Snapshots of the deposited films: a) MS (Ta and incoming species), b) HiPIMS moderate ion flux, c) HiPIMS high ion flux and the same without the substrate for observing the diffusion of incoming species, d) MS (Ta and incoming species), e) HiPIMS moderate ion flux, f) HiPIMS high ion flux. |
| In the text | |
|
Fig. 4 Plots of the simulated XRD a) MS, b) HiPIMS moderate ion flux, c) HiPIMS high ion flux films, d) predicted diffraction peak positions and RDF g(r), e) MS, f) HiPIMS moderate ion flux, g) HiPIMS high ion flux films. |
| In the text | |
Current usage metrics show cumulative count of Article Views (full-text article views including HTML views, PDF and ePub downloads, according to the available data) and Abstracts Views on Vision4Press platform.
Data correspond to usage on the plateform after 2015. The current usage metrics is available 48-96 hours after online publication and is updated daily on week days.
Initial download of the metrics may take a while.