| Issue |
Eur. Phys. J. Appl. Phys.
Volume 97, 2022
|
|
|---|---|---|
| Article Number | 37 | |
| Number of page(s) | 9 | |
| Section | Plasma, Discharges and Processes | |
| DOI | https://doi.org/10.1051/epjap/2022210291 | |
| Published online | 21 June 2022 | |
https://doi.org/10.1051/epjap/2022210291
Regular Article
Aerosol assisted atmospheric pressure plasma jet for a high deposition rate of silica-like thin films
1
LAPLACE, CNRS, UPS, INPT, Université de Toulouse, 31062 Toulouse, France
2
LCC, CNRS, Université de Toulouse, 31062 Toulouse, France
* e-mail: This email address is being protected from spambots. You need JavaScript enabled to view it.
Received:
16
December
2021
Received in final form:
31
March
2022
Accepted:
1
April
2022
Published online: 21 June 2022
Abstract
This paper investigated thin films deposition processes of silica-like based on the injection of liquid droplets in Atmospheric Pressure Plasma Jet–APPJ operated in open air. An aerosol of hexamethyldisilane is produced by a syringe-pump and injected in a nitrogen post-discharge for different liquid precursor and carrier gas flow rates. For high carrier gas flow, this process enables to form silica-like without addition of oxygen in the plasma phase. Furthermore, this process offers a thin film dynamic deposition rate from 500 to 1400 nm.m.min−1 depending on the carrier gas flow and the film structure departs from silica-like to organosilicon layers for the lowest flow rates. These evolutions are attributed to plasma–droplets interactions related to the transport of droplets, the evaporation of liquid and plasma polymerization.
© R. Magnan et al., Published by EDP Sciences, 2022
 This is an Open Access article distributed under the terms of the Creative Commons Attribution License (https://creativecommons.org/licenses/by/4.0), which permits unrestricted use, distribution, and reproduction in any medium, provided the original author(s) and source are credited.
1 Introduction
Plasma enhanced chemical vapor deposition (PECVD) enables to form a wide range of materials in thin films. Those deposited from silicon-based precursors develop different properties such as barrier coating, transparency and insulating properties relevant for various applications like packaging [1,2], anticorrosion [3,4], microelectronics [5,6], etc. These precursors are generally injected as gases that dissociate and ionize in the plasma phase.
In recent years, atmospheric pressure plasmas have been widely studied. For example, dielectric barrier discharges (DBDs) allow to elaborate dense and homogenous thin films for large surface in-line production [7], the thin film growth rate is controlled by several process parameters such as the discharge power, the gas composition, etc. Indeed, the discharge power proportional to the excitation frequency leads to an increase of the reactive species densities and, consequently, of the growth rate. For example, in Ar-NH3-SiH4 mixtures, Bazinette et al. showed that tuning the excitation frequency from kHz to MHz increases the growth rate from 10 up to 80 nm.min−1 [8]. Another set of parameters deals with the precursor, i.e. type, residence time and concentration. For example, the quantity of precursor injected in the gas phase can increase the deposition rate. However, it can also lead to the formation of powders in the gas phase due to an increase of the residence time [8]. To avoid such mechanisms, a lot of organosilicon precursors have been used. For example, Fanelli et al. showed that hexamethyldisiloxane (HMDSO) [(CH3)3SiOSi(CH3)3] can form various organosilicon (SiOxCyHz) as well as silica-like (SiOx) thin films in DBDs with deposition rates up to 100 nm.min−1 without powdering [9]. For silica layers, it needs adding oxygen in the gas phase. For example, FTIR spectra highlight the formation of quasi-pure SiO2 for an O2/HMDSO concentration ratio larger than 25.
However, DBDs are mainly adapted to processes over flat and insulating substrates [10]. Indeed, the presence of conductive materials on the electrodes modifies the regime of discharge and the inter-electrodes distance in the mm range is not easily compatible with the treatment of 3D objects. Plasma afterglows (or post-discharges) appear more suitable methods for thin film deposition on more complex substrates. Therefore, a lot of atmospheric pressure configurations, such as micro plasma jet [11] or jet [12,13], have been developed. As an example, injection of HMDSO in Atmospheric Pressure Plasma Jet (APPJ) system working at 13.56 MHz in Ar enables to form various SiOxCyHz films with deposition rates in the 150 nm.s−1 range [11,14] without dust particles production. In addition, mounted on 3D-axis robot, it enables to coat large surfaces, the dynamic deposition rate being directly related with the displacement velocities. However, a lot of those atmospheric plasma jets are working with noble gases [15,16]. They are then restricted by operating costs especially due to the consumption of the carrier gas. Noble gas substitution is then crucial, for example, by nitrogen or air [17].
In addition, those deposition processes are generally using volatile and stable precursors. Indeed, to ensure an efficient injection and deposition process, the molecules should have a vapor pressure of several Pa at room temperature or temperatures below its decomposition temperature, limiting the range of possibilities. An alternative solution deals with aerosol-assisted processes. Indeed, aerosols can be formed from liquid precursors or solutions (liquid mixtures, colloidal solutions, etc.) whatever their thermodynamic properties with an accurate flow control [15]. Coupled with APPJ, it leads to an original process at reduced cost. For example, Lommatzsch et al. [12] or Asadollahi et al. [18] deposited organosilicon thin films by injecting HMDSO as an aerosol in an APPJ. Commercially, the UL-Scan® plasma device from AcXys Plasma Technologies© has been developed to coat large surfaces. For example, Hamze et al. [13] used hexamethyldisilane (HMDS, [(CH3)3SiSi(CH3)3]) in this device: with a liquid precursor flow rate of 220 μL.min−1 (9.5 g.h−1), various SiOxCyHz (y = 4 − x and 3 ≤ x ≤ 4) films with a small roughness (around 4 nm) and low concentration of carbon are formed at dynamic deposition rate higher than 480 nm.m.min−1 without addition of O2. Indeed, post-discharge interactions with ambient air play a crucial role in thin film deposition [19]. For example, an efficient diffusion of species from the ambient air has been evidenced numerically by Reuter et al. [20] and experimentally by Dunnbier et al. [21]. Indeed, the latter highlighted, by optical emission spectroscopy measurements, the presence of OH* and O* formed through the decomposition of the O2 and H2O contaminant from ambient air along the APPJ. Because of the gas flow velocity at the APPJ output, a key role of the turbulence air incorporated in the plasma has been reported [19]. Hence, AAPJ in open air enables to depositing silica-like materials without adding O2. Coupled with an aerosol, these processes offer a generic process with high mass transport and thus higher deposition rates.
Our study aims to emphasize the role of plasma–droplets interactions on the deposition of silica-like coatings in the APPJ from AcXys Plasma Technologies©. The discharge, ignited in pure nitrogen, is coupled to an aerosol of HMDS produced, by a nebulizer and injected in the post-discharge. We focused on the role of gas and liquid flows in this aerosol-assisted process. Indeed, silica-like is obtained for high carrier gas flow rates. This process is controlled by different mechanisms of interaction between the aerosol (controlled by the liquid and gas flow rates) and the post-discharge, namely, the transport of droplets, the evaporation of the liquid and the precursor plasma polymerization.
2 Experimental details
The liquid injection and the plasma systems used in this work are schematically described in Figure 1.
The plasma process consisted in an industrial arc plasma torch UL-SCAN supplied by AcXys Technologies©. It consists in a transferred arc used to produce an Atmospheric Pressure Plasma Jet–APPJ. The arc was ignited at an excitation frequency fixed at 120 kHz, corresponding to a discharge power of 600 W. It was formed in pure N2 injected at 30 L.min−1 and the post-discharge operated in open air. The distance between the substrate and the nozzle was set at 1 cm and APPJ interacting surface with the substrate is a circular spot of 5 mm diameter.
HMDS (purity > 98% from Thermo Fisher Scientific©) was injected as an aerosol in the post-discharge, i.e. at the exhaust of the nozzle as presented in Figure 1. It was transported from a syringe pump with a flow rate (ΦHMDS) set between 250 and 1000 μL.min−1 (corresponding to 10.7–42.9 g.h−1) to a pneumatic nebulizer (Mira Mist from Burgener research supplied with N2 flow equal to 0.9 L.min−1) that generated the aerosol of liquid droplets. At the exit of the nebulizer, it was diluted in a mixing chamber with a carrier gas (N2) set at a flow rate (ΦHMDS) ranging from 1 and 15 L.min−1 and transported toward the post-discharge through a nozzle with four holes.
To form 2D coatings, the APPJ was mounted on a 3-axis robot. With a scan speed (along x-axis) set at vs = 6m.min−1 (100 mm.s−1) and a displacement along the y-axis (Δy) at 5 mm Figure 1. In these conditions, one pass on a surface of 10 × 10 cm2 lasted around 20 s.
Before coating, the intrinsic silicon substrate was pre-treated by one plasma passing without liquid precursor. Thin films were then deposited for different HMDS (ΦHMDS) and N2 carrier gas (ΦN2) flow rates using the parameters summarized in Table 1. For the deposition process, the number of APPJ passes is arbitrary set to N = 3.
The film thickness, d, was determined by profilometry using a TENCOR alpha step IQ. In order to compare our result to ones reported by Lommatzsch et al. [12] and Hamze et al. [13], the dynamic thin film growth rate, v (in nm.m.min−1), was determined from the film thickness (d), considering the number of pass (N) and the scanning speed (vS) using the equation v = (d/N).vS.
The surface morphology was probed by Atomic Force Microscopy (AFM BRUKER Multimode 8) in tapping mode and by scanning electron microscopy (SEM FEG JEOL JSM 6700F). Concerning AFM measurements, the root mean square roughness Rq was determined over the 5 μm × 5 μm probed surface. Images were treated using Imagej® software. Concerning the SEM observation, the image is acquired with an extraction voltage of 10 kV and a magnification of 10k.
Ellipsometric spectra recorded on a SEMILAB SE-2000 were used to define the conditions of flow rates to obtain a silica-like coating. The fit regression was limited to a single layer of smooth and homogeneous silica considering an Effective Medium Approximation (EMA) model of SiO2 with void and the thickness d measured by profilometry. To emphasize the silica-like structure of the films, the accuracy of fit (R²) was determined for the different conditions. A R2 > 0.9 means a quasi-pure SiO2 layer while a lower R2 suggests that the coating structure departs from silica.
As a complement, Fourier Transform Infra-Red (FTIR) spectroscopy was performed by a BRUKER Vertex 70 spectrometer in transmission mode, all spectra were acquired by averaging 20 scans with a spectral resolution of 4 cm−1 in the range of 400–4000 cm−1.
Experiment parameters summary.
3 Results and discussion
3.1 Silica-like coatings
Silica-like thin films are obtained with the carrier gas set to = 15 L.min−1 coupled with HMDS injection fixed at = 500 μL.min−1. Indeed, ellipsometry highlights that the layer consists in SiO2 (volume fraction of 92%) with an accuracy better than 0.95. The silica-like structure is also confirmed by FTIR as presented in Figure 2. Indeed, the spectrum highlights the main features of SiO2, i.e. the characteristic absorption bands of Si-O-Si located at 800 (bending), 1075 (AS1) and 1150 cm−1 (AS2) (asymmetric stretching) [23]. Si-OH at 923 cm−1 and OH between 3100 and 3800 cm−1 related to hydroxyl groups as well as Si-(CH3)x bending absorption at 1270 cm−1 and CHx stretching mode at 2960 cm−1 are also observed in small abundance. These bands are characteristics of the incomplete fragmentation of the organosilicon precursor as classically observed in plasma deposited silica. Hence, silica-like coatings are obtained without addition of O2. As previously reported by Asad et al. [19], due to the flow turbulence, O2 and H2O from ambient air can be incorporate in the post-discharge, and contribute to the plasma process (dissociation, oxidation). After 3 passes, the film thickness is found around 250 nm. Considering the scan speed and the number of pass, it corresponds to a dynamic deposition rate of about 500 nm.m.min−1 per pass, similar to the ones reported by Lommatzsch et al. [12] or Hamze et al. [13]. On a surface of 10 × 10 cm2, one can estimate the deposition rate of 0.4 g.h−1 for an injection of 21 g.h−1 of HMDS.
Finally, with such a so high deposition rate, one can expect a high roughness. The typical AFM image presented in Figure 2 shows an upper roughness value of 36 nm which is in the same range as [13]. In addition, AFM measurement, as well as, SEM images show the presence of spheres with a diameter of up to 500 nm. Such spheres suggest a contribution of liquid droplets in the deposition process. Considering an initial droplet size of few μm at the exhaust of the nebulizer [13,24], it suggests that a lot of plasma–droplet interactions are involved, as plasma polymerization and/or thermal evaporation of the liquid.
Hence, this process forms silica-like coatings at high deposition rate. One can rely these observations to the aerosol. In order to further investigate the plasma – droplet interactions, the effects of the precursor and carrier gas flow rates are discussed in the following parts.
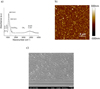 |
Fig. 2 Thin film deposited for ΦHMDS = 500 μL min−1 and |

3.2 Influence of the liquid precursor flow rate
Thin films were deposited for different precursor flow rate, whereas being unchanged and set to 15 L.min−1. As presented in Figure 3a, the thicknesses and roughnesses are slightly affected by Whatever the precursor flow rate, the thin film thickness is ranging between 250 and 300 nm corresponding to a dynamic deposition rate of about 500–600 nm.m.min−1. The plasma deposition rate seems to be limited by the conversion efficiency related to the low plasma power injected in these experiments. In addition, the roughness remains constant around 35 nm and the surface morphology highlights the presence of the same spherical shape with a size around 500 nm evenly distributed whatever the precursor flow rate Figure 3.
To emphasize the effect of ΦHMDS on the aerosol, rapid images of the light (green LED at λ = 530 nm) scattered by the aerosol at the exhaust of the nebulizer are recorded by a CCD camera for different conditions. Figure 4 shows typical pictures taken for various ΦHMDS: it highlights that the aerosol consists in a dense fog, the scattered light intensity increasing with the flow rate, i.e. with the quantity of liquid injected in the aerosol. The scattered light integrated on the whole picture is reported as a function of the flow rate in Figure 4. Considering Mie scattering, the linear variation of the scattered light intensity with ΦHMDS cannot be attributed to the droplets size - the latter remaining constant for the same liquid at a fixed temperature and pressure [25]. It suggests that ΦHMDS is only increasing the number of droplets injected in the post-discharge.
As an increase of the precursor flow rate, i.e. the number of droplets, does not modify the deposition rate, it means that the deposition yield decreases. Moreover, the morphology remains unchanged.
Finally, FTIR shows that the film structure is also independent on the liquid flow rate FHMDS (Fig. 5). Indeed, the similar FTIR signature with the presence of Si-O-Si (AS1 and AS2) with a small quantity of Si-OH, Si-CH3 and CHx bands shows a silica-like structure of the different coatings, i.e. that the plasma process is not affected by the liquid flow rate.
It suggests that the deposition process is limited by plasma–droplet interactions. In these conditions, we assume that the plasma power limits the conversion/decomposition of the precursor. With the range of HMDS flow rate studied here, these interactions are saturated, leading to a process mass balance decreasing with ΦHMDS.
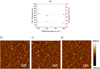 |
Fig. 3 (a) Evolution of the thin film thickness d and Rq as a function of the precursor flow rate for |


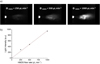 |
Fig. 4 (a) Photos of the aerosol at the nebulizer exit for ΦHMDS = 250, 500 and 1000 μL min−1 (b) Intensity of the light scattering as a function of the precursor flow rate (values extracted from aerosol photos). |
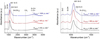 |
Fig. 5 FTIR spectra of the thin films deposited for ΦHMDS = 250, 500 and 1000 μL min−1 and |

3.3 Influence of carrier gas flow rate
To study and highlight the effects of transport, the role of the carrier gas is studied and the precursor flow rate, ΦHMDS, is set at 500 μL.min−1. Figure 6 reports the evolution of the film thickness, surface roughness and surface morphology from the previous optimal condition,  = 15 L.min−1 down to 1 L.min−1.
Both the film thickness and the roughness, are decreasing with the carrier gas flow rate suggesting that plasma–droplets interactions are modified (Fig. 6). For example, it can affect the transport of droplets: the lower the carrier gas flow rate, the lower the driving of the aerosol with the carrier gas. Hence, the thickness would be lowered for small  .
.
However, AFM shows that the surface morphology is also affected by the carrier gas flow rate (Fig.6). From about 500 nm observed for  = 15 L.min−1, the size of the spherical grains observed on the sample are more abundant and larger, around 700 nm, for
  = 1 L.min−1. It implies that the form of the aerosol is also modified by the gas flow rate. Hence, the role of droplet transport is not so direct. On one hand, the carrier gas flow rate can efficiently transport the aerosol to the center of the post discharge, thus improving the dissociation and plasma polymerization of the precursor, as droplets of liquid. On the other hand, at higher N2 flow rate, evaporation of the liquid in the aerosol can increase, improving the dissociation of the precursor, as a gas, in the post discharge. The latter case would densify the film as observed experimentally from the variations of the roughness.
Hence, with the variation of the thickness and, consequently, the deposition rate, the carrier gas flow rate must increase the deposition yield.
This is true if the film structure is independent on the carrier gas flow. However, drastic modifications are observed on the FTIR spectra (Fig. 7). Especially, in the 1000 to 1200 cm−1 range (inset Fig. 7), though FTIR spectra are dominated by a large band corresponding to the asymmetric stretching modes of Si-O-Si with a maximum at 1073 cm−1 (AS1 mode) and a shoulder at 1200 cm-1 (AS2 mode), the coating obtained for different carrier gas flow rate clearly emphasize the shoulder at 1200 cm-1 attributed to AS2 mode. In addition, the intensity of the main band (1073 cm−1) increases with the carrier gas flow rate in agreement with the intensity of the Si-CH3 band at 1270 cm−1. The latter is emphasized by the evolution of AS1/Si-CH3 ratio with the flow rate (Fig. 7). Hence, the film at lower N2 flow rate is more organic than the silica-like coating deposited at 15 L.min−1. It means that the film density is lower, decreasing the deposition yield though the deposition rate increases.
These chemical evolutions are confirmed by spectroscopic ellipsometry: silica-like structure is completely unsuitable to fit ellipsometric data of the films produced at carrier gas flow rate lower than 10 L.min−1 as suggested by the drastic evolution of R2; (and the darkened area for R² < 0.9) (Fig. 7).
Hence, increasing the carrier gas flow rate induces a higher precursor dissociation and polymerization as well as a higher oxidation due to penetration of the droplets at the center of the plasma post discharge. However, the evaporation of the droplet can be also modified during the transport or at the center of the plasma post discharge.
As summarized in Figure 8, in our process conditions, the carrier gas flow rate,  , is the key parameter to control the plasma process. It is responsible of the transport of droplets in the post-discharge leading to an efficient dissociation and plasma polymerization of the organosilicon precursor. This transport can also affect the size of the droplets due to the evaporation of the liquid. The carrier gas flow enables to tailor the thin film morphology and composition, whereas the liquid flow rate only increases the number of droplets in the aerosol.
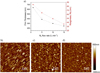 |
Fig. 6 (a) Evolution of the thin film thickness and roughness as a function of the carrier gas flow rate for = 500 μL.min−1. 5 μm × 5 μm AFM surface topography mapping for = 500 μL.min−1 and (b) = 1 L.min−1, (c) = 5 L.min−1 and (d) |

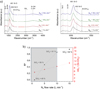 |
Fig. 7 (a) FTIR spectra of the thin films deposited for |

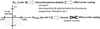 |
Fig. 8 Roles of the carrier gas and the liquid flow rates on the aerosol-assisted APPJ process. |
4 Conclusion
This study aimed to discuss aerosol-assisted APPJ processes. It highlights the significant effect of the aerosol on the thin film characteristics deposited. Especially, the aerosol injection parameters such as the carrier gas (N2) and the liquid precursor (HMDS) flow rates control the deposition.
While the liquid precursor flow rate does not modify the global process (deposition rate, surface roughness and film structure) though the number of droplets injected in the aerosol increases, pure silica is obtained at high deposition rate (500 nm.m.min−1) if the carrier gas flow rate is high enough. It suggests that the carrier gas is transporting the droplets in the post-discharge, leading to an efficient plasma polymerization and oxidation during the process. Indeed, when reducing the carrier gas flow rate, the thin films departs from pure silica to more organic and less dense coatings (SiOxCyHz). This is attributed to a smaller penetration of the droplets inside the post-discharge related to the smaller carrier gas flow.
Deposition processes with aerosol-assisted APPJ are controlled by the plasma - droplets interactions. The latter can affect the dissociation and plasma polymerization of the precursor and the transport of the aerosol to the center of the post-discharge where it can efficiently oxidize and/or the droplet evaporation during the transport which can modify the droplet size and thus plasma–droplets interactions.
Author contribution statement
Romain MAGNAN: experimental work and trials, original writing of the document, discussions, reviewing, correction; Richard CLERGEREAUX: technical supervision, discussions, reviewing, correction; Christina VILLENEUVE-FAURE: AFM measurements discussions, reviewing, correction; Benoît LANTIN: discussions, FTIR measurements, reviewing; Guillaume CARNIDE: discussions, CCD camera measurements, reviewing; Patrice RAYNAUD: discussions, reviewing, correction; Nicolas NAUDE: technical supervision, discussions, reviewing, correction.
Acknowledgments
This work was supported by “region Occitanie” in France.
References
- M. Creatore, F. Palumbo, R. D’Agostino, P. Fayet, Surf. Coat. Technol. 142–144, 163 (2001) [CrossRef] [Google Scholar]
- M. Creatore, F. Palumbo, R. D’Gostino, Plasmas Polym. 7, 291 (2002) [CrossRef] [Google Scholar]
- L. Zajíčková et al., Surf. Coat. Technol. 142–144, 449 (2001) [CrossRef] [Google Scholar]
- J. Bour et al., Plasma Process. Polym. 5, 788 (2008) [CrossRef] [Google Scholar]
- A. Grill, J. Appl. Phys. 93, 1785 (2003) [CrossRef] [Google Scholar]
- A. Milella, F. Palumbo, J.L. Delattre, F. Fracassi, R. d’Agostino, Plasma Process. Polym. 4, 425 (2007) [CrossRef] [Google Scholar]
- F. Massines, C. Sarra-Bournet, F. Fanelli, N. Naudé, N. Gherardi, Plasma Process. Polym. 9, 1041 (2012) [CrossRef] [Google Scholar]
- R. Bazinette, J.F. Lelièvre, L. Gaudy, F. Massines, Energy Proc. 92, 309 (2016) [CrossRef] [Google Scholar]
- F. Fanelli, S. Lovascio, R. D’Agostino, F. Arefi-Khonsari, F. Fracassi, Plasma Process. Polym. 7, 535 (2010) [CrossRef] [Google Scholar]
- J.F. Lelièvre et al., Prog. Photovolt. Res. Appl. 27, 1007 (2019) [CrossRef] [Google Scholar]
- V. Raballand, J. Benedikt, S. Hoffmann, M. Zimmermann, A. Von Keudell, J. Appl. Phys. 105, 8 (2009),10.1063/1.3108541 [Google Scholar]
- U. Lommatzsch, J. Ihde, Plasma Process. Polym. 6, 642 (2009) [CrossRef] [Google Scholar]
- H. Hamze, M. Jimenez, D. Deresmes, A. Beaurain, N. Nuns, M. Traisnel, Appl. Surf. Sci. 315, 531 (2014) [CrossRef] [Google Scholar]
- H. Kakiuchi, K. Higashida, T. Shibata, H. Ohmi, T. Yamada, K. Yasutake, J. Non-Cryst. Solids 358, 2462 (2012) [CrossRef] [Google Scholar]
- W.C. Zhu, Q. Li, X.M. Zhu, Y.K. Pu, J. Phys. D.: Appl. Phys. 42, 0 (2009) [Google Scholar]
- A. Van Deynse, P. Cools, C. Leys, R. Morent, N. De Geyter, Surf. Coat. Technol. 276, 384 (2015) [CrossRef] [Google Scholar]
- U. Lommatzsch, D. Pasedag, A. Baalmann, G. Ellinghorst, H.E. Wagner, Plasma Process. Polym. 4, 1041 (2007) [Google Scholar]
- S. Asadollahi, J. Profili, M. Farzaneh, L. Stafford, Materials (Basel) 12 (2019) [Google Scholar]
- S.S. Asad et al., Plasma Process. Polym. 6, 508 (2009) [Google Scholar]
- S. Reuter et al., Plasma Sources Sci. Technol. 21 (2012), 10.1088/0963-0252/21/2/024005. [Google Scholar]
- M. Dünnbier et al., J. Phys. D.: Appl. Phys. 46, 435203 (2013) [CrossRef] [Google Scholar]
- L. Brès, A. Sanchot, B. Rives, N. Gherardi, N. Naudé, M. Aufray, Surf. Coat. Technol. 362, 388 (2019) [CrossRef] [Google Scholar]
- P.G. Pai, S.S. Chao, Y. Takagi, G. Lucovsky, J. Vac. Sci. Technol., A 4, 689 (1986) [CrossRef] [Google Scholar]
- P. Fabio, Coatings (2020), 10.3390/ma13132931 [PubMed] [Google Scholar]
- S.K. Friedlander, Ann. N.Y. Acad. Sci. (1983) [Google Scholar]
Cite this article as: Romain Magnan, Richard Clergereaux, Christina Villeneuve-Faure, Benoît Lantin, Guillaume Carnide, Patrice Raynaud, Nicolas Naude, Aerosol assisted atmospheric pressure plasma jet for a high deposition rate of silica-like thin films, Eur. Phys. J. Appl. Phys. 97, 37 (2022)
All Tables
All Figures
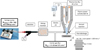 |
Fig. 1 Details of the APPJ coupled with the injection system modified/updated from [22]. |
| In the text | |
|
Fig. 2 Thin film deposited for ΦHMDS = 500 μL min−1 and |
| In the text | |
|
Fig. 3 (a) Evolution of the thin film thickness d and Rq as a function of the precursor flow rate for |
| In the text | |
|
Fig. 4 (a) Photos of the aerosol at the nebulizer exit for ΦHMDS = 250, 500 and 1000 μL min−1 (b) Intensity of the light scattering as a function of the precursor flow rate (values extracted from aerosol photos). |
| In the text | |
|
Fig. 5 FTIR spectra of the thin films deposited for ΦHMDS = 250, 500 and 1000 μL min−1 and |
| In the text | |
|
Fig. 6 (a) Evolution of the thin film thickness and roughness as a function of the carrier gas flow rate for = 500 μL.min−1. 5 μm × 5 μm AFM surface topography mapping for = 500 μL.min−1 and (b) = 1 L.min−1, (c) = 5 L.min−1 and (d) |
| In the text | |
|
Fig. 7 (a) FTIR spectra of the thin films deposited for |
| In the text | |
|
Fig. 8 Roles of the carrier gas and the liquid flow rates on the aerosol-assisted APPJ process. |
| In the text | |
Current usage metrics show cumulative count of Article Views (full-text article views including HTML views, PDF and ePub downloads, according to the available data) and Abstracts Views on Vision4Press platform.
Data correspond to usage on the plateform after 2015. The current usage metrics is available 48-96 hours after online publication and is updated daily on week days.
Initial download of the metrics may take a while.