Fig. 7
Download original image
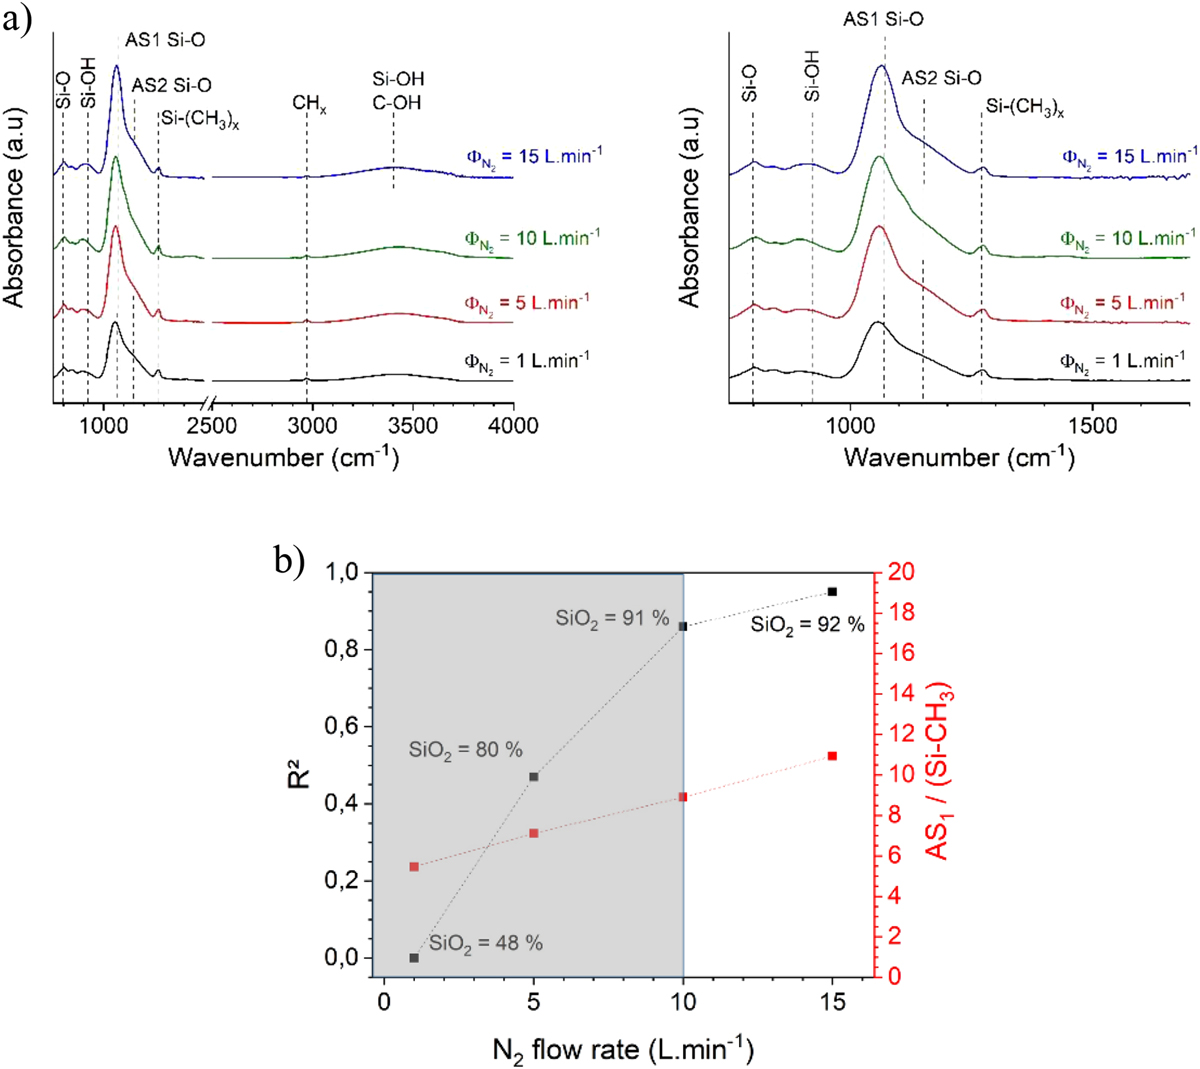
(a) FTIR spectra of the thin films deposited for ![]() = 1, 5, 10 and 15 L min−1 and ΦHMDS = 500 µL min.−1. Zoom was done in the 700 – 1700 cm−1 range. (b) Evolution of the ellipsometry fit precision (R2)-from the fit regression considers a smooth and homogeneous silica-like layer, i.e. a single layer defined as a mixture of SiO2 with void considering an Effective Medium Approximation (EMA) model- and AS1 / SiCH3 ratio as a function of the carrier gas flow rate for ΦHMDS = 500 µL min.−1. Silica-like and organosilicon range are depicted in white and grey respectively.
= 1, 5, 10 and 15 L min−1 and ΦHMDS = 500 µL min.−1. Zoom was done in the 700 – 1700 cm−1 range. (b) Evolution of the ellipsometry fit precision (R2)-from the fit regression considers a smooth and homogeneous silica-like layer, i.e. a single layer defined as a mixture of SiO2 with void considering an Effective Medium Approximation (EMA) model- and AS1 / SiCH3 ratio as a function of the carrier gas flow rate for ΦHMDS = 500 µL min.−1. Silica-like and organosilicon range are depicted in white and grey respectively.
Current usage metrics show cumulative count of Article Views (full-text article views including HTML views, PDF and ePub downloads, according to the available data) and Abstracts Views on Vision4Press platform.
Data correspond to usage on the plateform after 2015. The current usage metrics is available 48-96 hours after online publication and is updated daily on week days.
Initial download of the metrics may take a while.