Fig. 6
Download original image
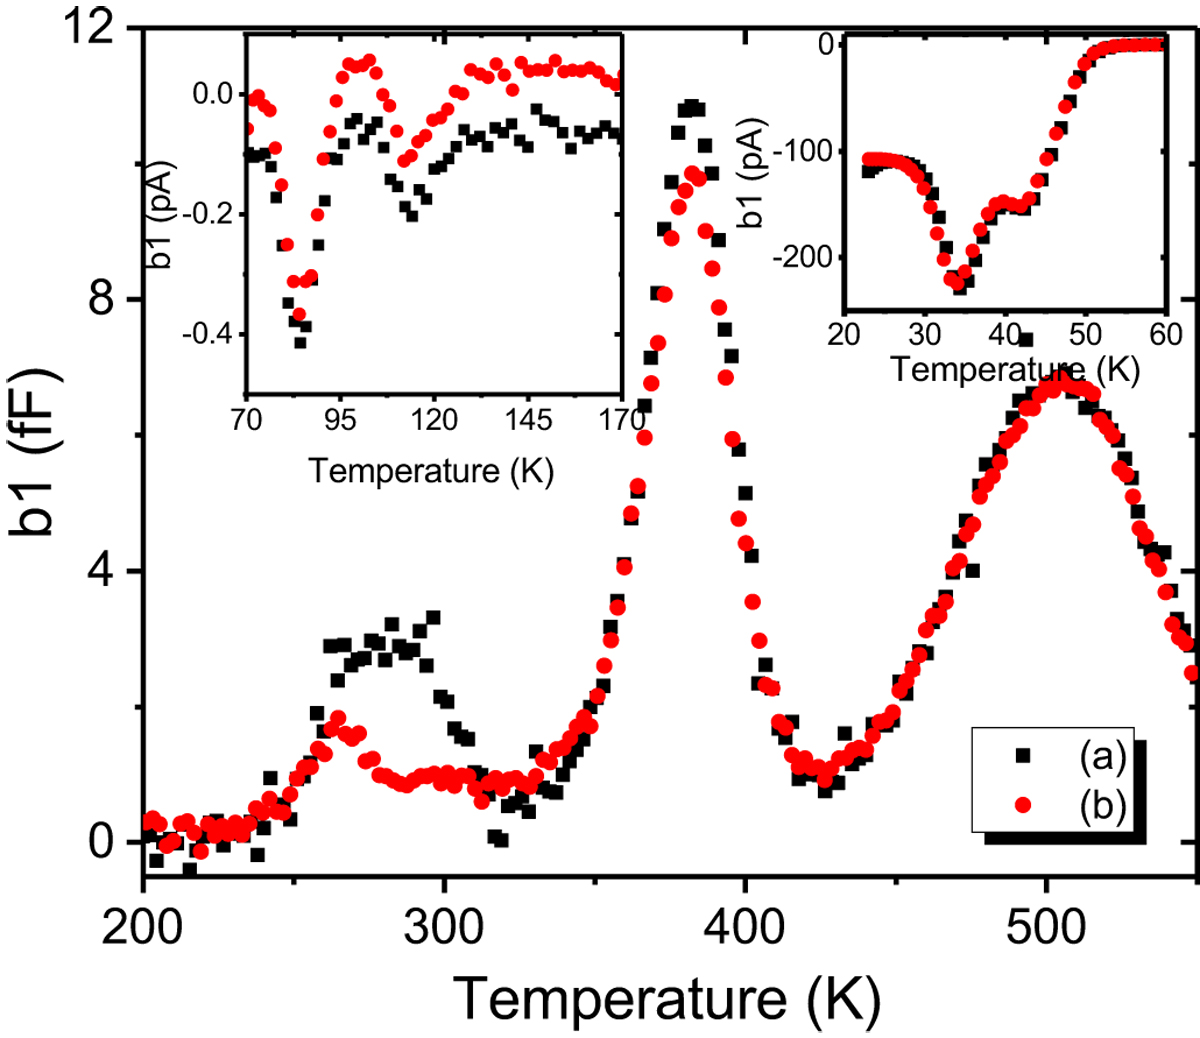
DLTS signal (correlation b1) with a period of 204.8 ms on the diodes (a) and (b) between 200 and 550 K. The inserts are current DLTS (I-DLTS) spectrum between 20 and 60 K (upper right) and 70 to 170 K (top left). The reverse bias V R = − 10 V, the pulse voltage V P = − 0.1 V and the pulse duration t P = 100 s for all measures.
Current usage metrics show cumulative count of Article Views (full-text article views including HTML views, PDF and ePub downloads, according to the available data) and Abstracts Views on Vision4Press platform.
Data correspond to usage on the plateform after 2015. The current usage metrics is available 48-96 hours after online publication and is updated daily on week days.
Initial download of the metrics may take a while.