Fig. 4
Download original image
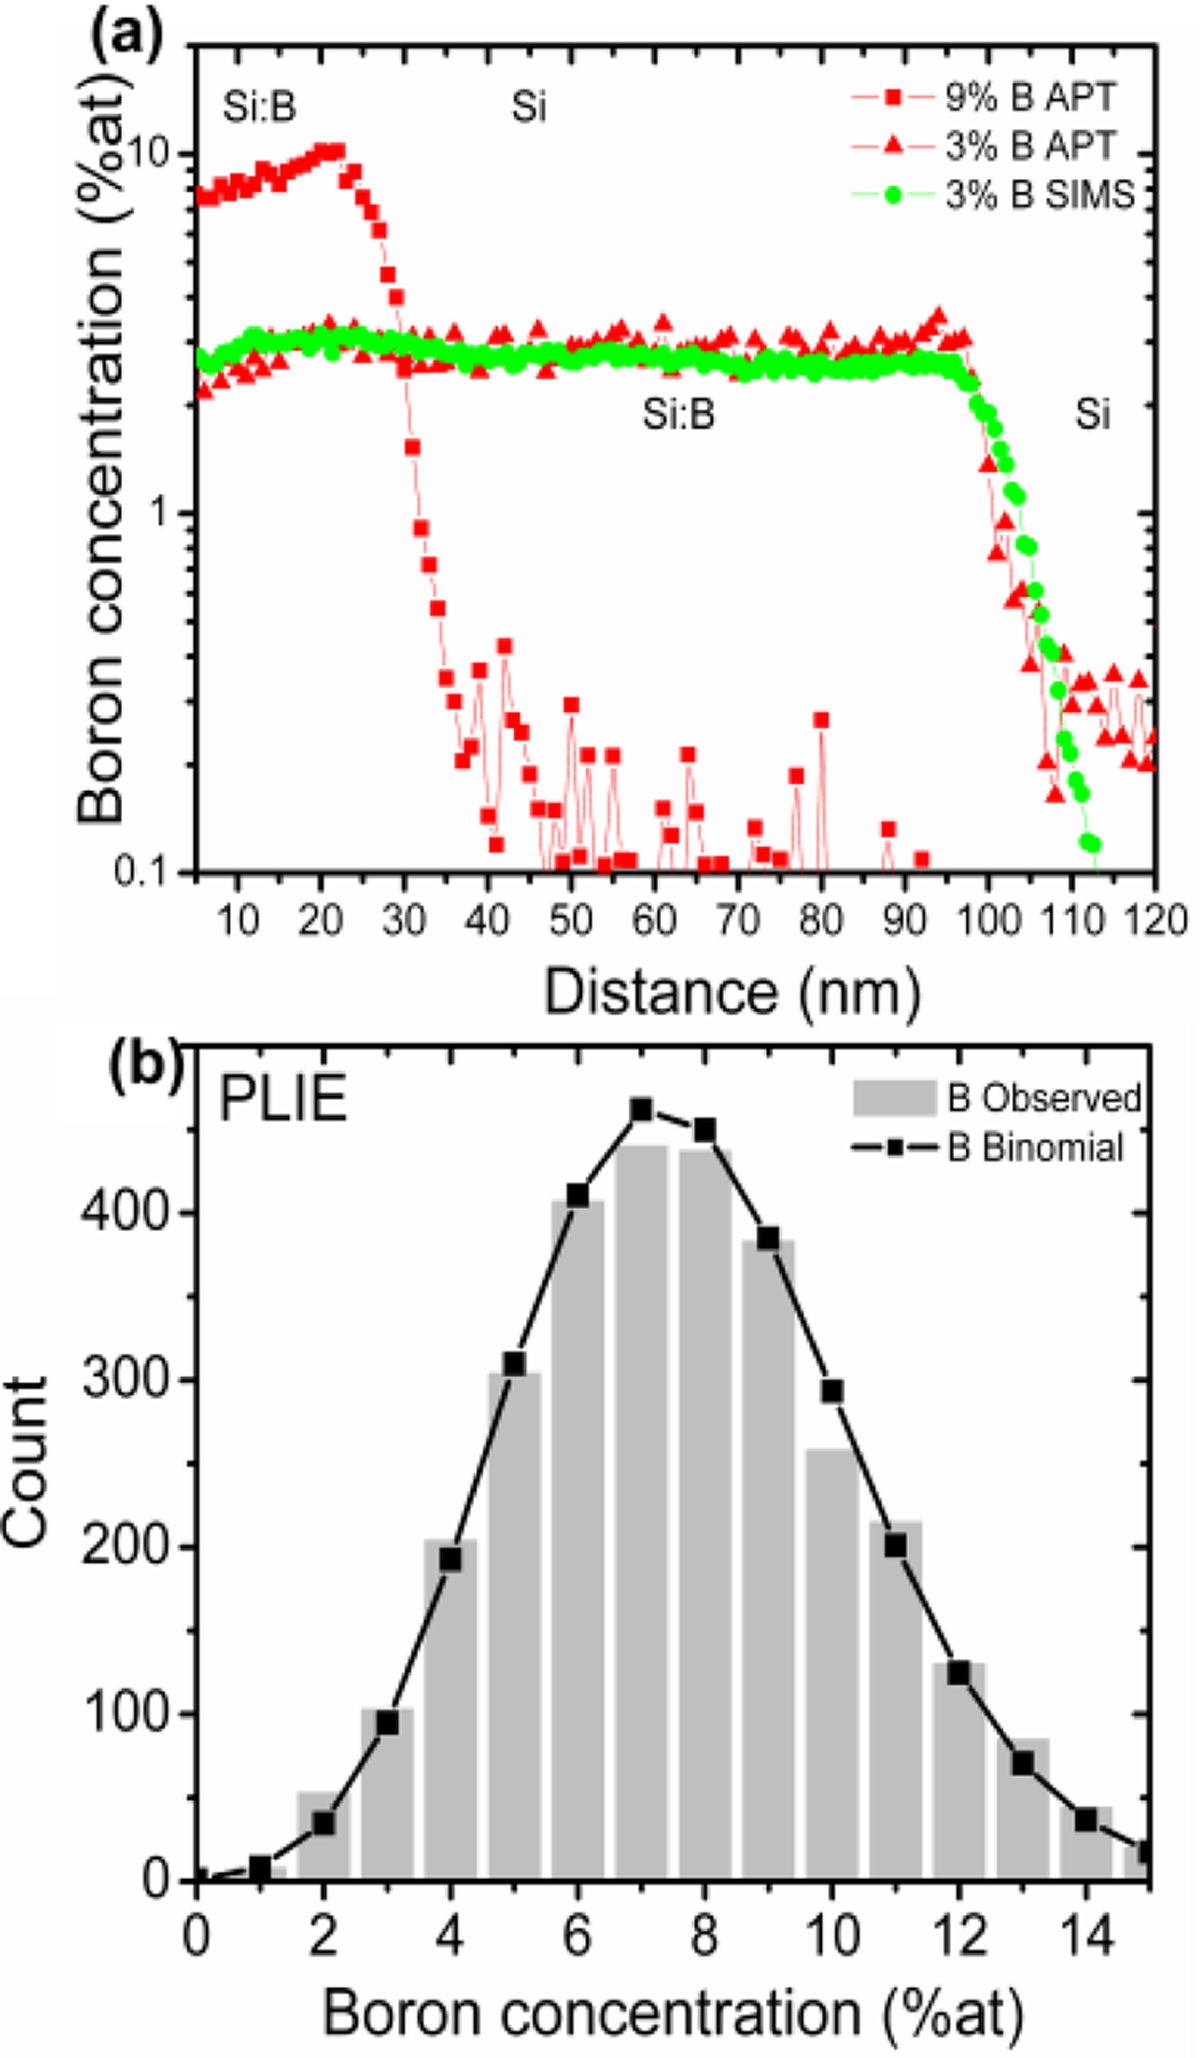
Boron distribution for PLIE samples: (a) one-dimensional boron depth distribution calculated by integrating the data of Figure 3 over a 10 nm radius cylindrical from the two volumes of Figure 3 and boron depth measured by secondary ion mass spectrometry (SIMS) for 3 at.% of B. (b) Example of distribution of the boron content (histogram) in sets of 200 atoms located in a 30 × 30 × 10 nm3 data slice of 9 at.% boron compared to a binomial distribution.
Current usage metrics show cumulative count of Article Views (full-text article views including HTML views, PDF and ePub downloads, according to the available data) and Abstracts Views on Vision4Press platform.
Data correspond to usage on the plateform after 2015. The current usage metrics is available 48-96 hours after online publication and is updated daily on week days.
Initial download of the metrics may take a while.