Fig. 2
Download original image
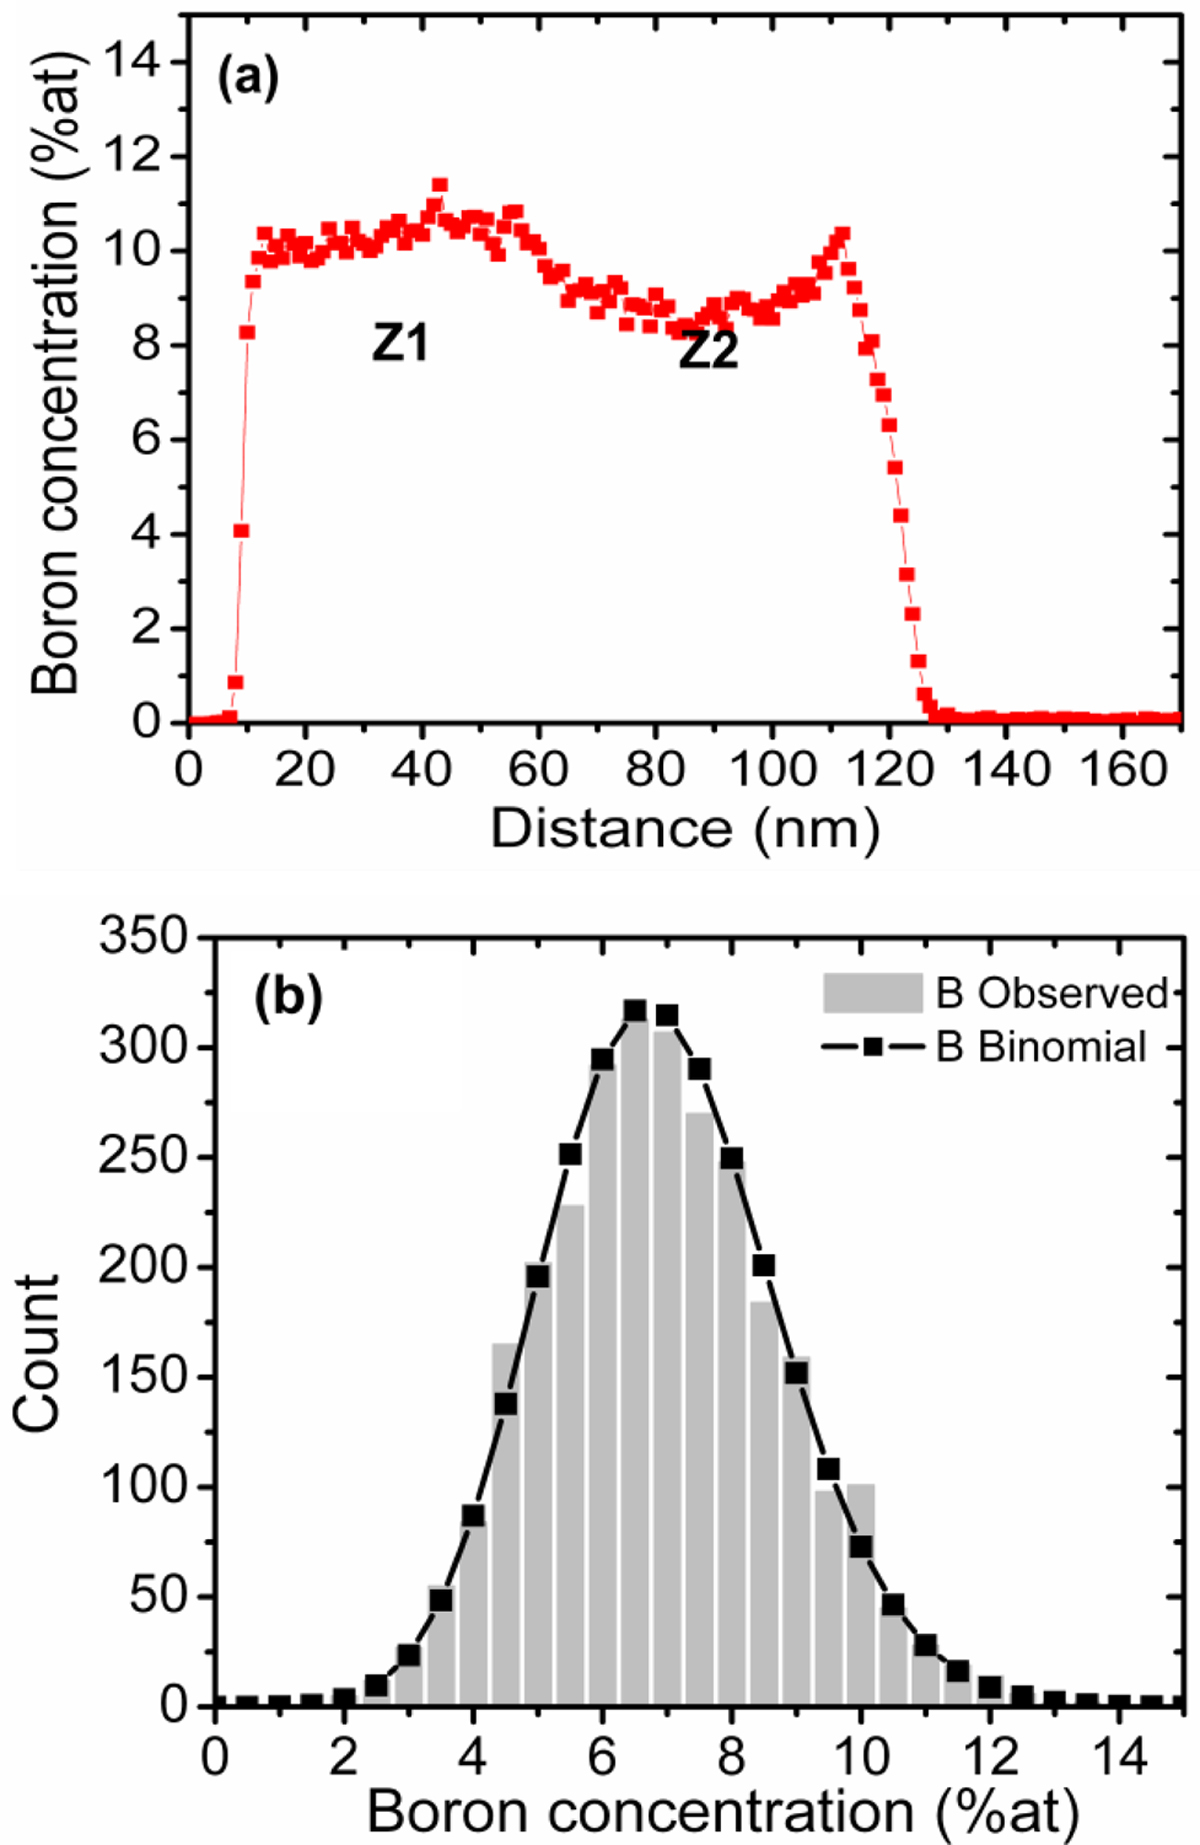
Distribution of Boron for the GILD sample: (a) one-dimensional boron depth distribution calculated by integrating the data of Figure 1 over a cylindrical volume with a radius of 10 nm. (b) Distribution of the boron content (histogram) in sets of 200 atoms located in 30 × 30 × 10 nm3 data slice (position Z2) compared to a binomial distribution.
Current usage metrics show cumulative count of Article Views (full-text article views including HTML views, PDF and ePub downloads, according to the available data) and Abstracts Views on Vision4Press platform.
Data correspond to usage on the plateform after 2015. The current usage metrics is available 48-96 hours after online publication and is updated daily on week days.
Initial download of the metrics may take a while.