| Issue |
Eur. Phys. J. Appl. Phys.
Volume 97, 2022
Special Issue on ‘Nanoalloys: Kinetic and Environmental Behaviour’, edited by Pascal Andreazza, Riccardo Ferrando and Liu Xiaoxuan
|
|
|---|---|---|
| Article Number | 32 | |
| Number of page(s) | 7 | |
| Section | Nanomaterials and Nanotechnologies | |
| DOI | https://doi.org/10.1051/epjap/2022210290 | |
| Published online | 26 May 2022 | |
https://doi.org/10.1051/epjap/2022210290
Regular Article
Chemical and magnetic order in mass-selected large FeRh nanomagnets embedded in a carbon matrix
Institut Lumière Matière, UMR5306 Univ. Lyon 1- CNRS, 69622 Villeurbanne cedex, France
* e-mail: This email address is being protected from spambots. You need JavaScript enabled to view it.
Received:
16
December
2021
Received in final form:
1
March
2022
Accepted:
9
March
2022
Published online: 26 May 2022
Abstract
In this paper, we present some specific chemical and magnetic order results obtained on bimetallic FeRh nanoparticles prepared under non-equilibrium conditions using mass-selected Low Energy Cluster Beam Deposition. Clusters around 7 nm incident diameter are in situ sandwiched between amorphous carbon films before transfer in air, with different surface coverage (from nearly isolated particles to percolating 2D films) in order to artificially increase diameters of the nanoparticles (NPs) by coalescence. On such FeRh@C samples, we observe different NPs morphologies and magnetic responses after UHV thermal treatments. By transmission electron microscopy (TEM), we show that after moderate annealing, nanoalloys evolved from a metastable structure towards the equilibrium CsCl-type (B2) chemically ordered phase with a more spherical shape. While from Superconducting Quantum Interference Device (SQUID) magnetometry measurements on 700 °C-annealed FeRh@C samples, we clearly evidence huge magnetization enhancement for such B2 nanoalloys with robust ferromagnetic (FM) signature even at very low temperature unlike their bulk counterparts.
© G. Herrera et al., Published by EDP Sciences, 2022
 This is an Open Access article distributed under the terms of the Creative Commons Attribution License (http://creativecommons.org/licenses/by/4.0), which permits unrestricted use, distribution, and reproduction in any medium, provided the original work is properly cited.
1 Introduction
Exploring the magnetic properties of nanostructures continues to attract significant attention thanks in part to potential applications in spintronics and neuromorphic computing [1]. However, for single-domain nanoparticles, where the magnetic anisotropy energy (MAE) is in competition with the thermal activation energy, the superparamagnetic (SP) behaviour is not compatible with data storage at ambient temperature. A promising way to overcome this problem could be to design alloy clusters combining a 3d metal with a high-spin moment (Fe, Co) and a 4d/5d metal such as Pd, Rh, or Pt, which induces a large orbital magnetic moment on the 4d/5d metal by exchange [2]. In the last decade, bimetallic tetragonal L10 CoPt and FePt nanoalloys have been extensively studied in order to benefit from their high magnetocrystalline anisotropy and thusly overcome the SP limit. Nevertheless, even if a high chemical order has been observed at the nanoscale upon annealing under UHV conditions, the achievement of a consequent MAE enhancement remains elusive [3,4]. We have experimentally and theoretically correlated this phenomenon to the fact that pure Co layers do not match the underlying Pt layer in such L10-like phase because of specific local relaxation in the nanoalloy [5–7].
For other perspectives, a lot of investigations on FeRh nanoalloys have also been performed as a metamagnetic phase transition from antiferromagnetic (AF) to ferromagnetic (FM) ordering is expected around 370 K for an alloy in the CsCl-type (B2) chemically ordered stable phase accompanied by a 1% volume expansion [8]. We have previously experimentally shown that assemblies of mass-selected (M–S) FeRh clusters smaller than 5 nm in diameter diluted in carbon matrix, can reach the B2 structure after annealing under vacuum but with the persistence of the FM order down to 3 K [9,10].
In this paper, we have prepared larger B2 FeRh nanoparticles in order to try to exceed the critical size for the metamagnetic phase transition, by studing cross-correlations across chemical order, size and concentration effects on their structure and magnetic response. Then, assemblies of M–S FeRh clusters preformed in the gas phase using the Low Energy Cluster Beam Deposition (LECBD) technique were diluted with different concentrations in carbon matrix and investigated upon annealing by Transmission Electron Microscopy (TEM) and Superconducting Quantum Interference Device (SQUID) magnetometry masurements.
2 Experimental details
2.1 Sample synthesis
FeRh clusters are pre-formed in the gas phase using a laser vaporization source working in the LECBD regime. Briefly, a YAG laser (λ = 532 nm, pulse duration 8 ns, frequency 20 Hz) is used to vaporize a mixed equiatomic FeRh target rod and a continuous flow of inert gas (He, 30 mbar) is injected to rapidly cool the generated plasma and to nucleate clusters submitted to a supersonic expansion under vacuum. Our apparatus is equipped with a quadrupolar electrostatic mass-deviator allowing us to deposit mass-selected clusters without fragmentation on a substrate (amorphous carbon grid for TEM, and Si wafer for other measurements) in ultra-high vacuum (UHV) at a base pressure in the range of 10−10 mbar [11]. A homemade UHV carbon evaporator is used for in situ embedding of the nanoparticles in an inert amorphous carbon matrix before transfer in air [12]. Moreover, both independent clusters/matrix beams allow to adjust separately nanoparticles (NPs) size and concentrations but also to control coalescence and chemical order during UHV high temperature post-annealing.
Here we focus our attention on stoichiometric FeRh NPs embedded in carbon matrix (named FeRh@C) with the largest obtainable size from our apparatus, which corresponds to around 7 nm for the incident cluster diameter. Two different surface cluster coverages referred to as low density (LD) with well separated NPs and high density (HD) for NPs assembly nearly at the 2D percolation threshold, have been chosen in order to study before and after annealing, the NPs structure, morphology and magnetic interactions effects on physical properties.
2.2 Structural characterization
TEM was performed at 200 kV from a JEOL 2100 microscope with a LaB6 electron source. Images and diffraction patterns were recorded using a bottom mounted Gatan Orius SC100 CCD camera.
From TEM observations, the efficiency of the mass selection on FeRh clusters has been systematically proven on very thin discontinuous cluster films of around 0.1 nm equivalent thickness, capped with a carbon film. The size histogram can be described by a Gaussian distribution centered on a mean diameter Dm with a relative dispersion ω = σD/Dm (where σD is the standard deviation) around 0.1 in the [2–7 nm] size range [9]. But for the largest nanoparticles, spherical shapes are no longer expected and ramified structures are observed by TEM on as-prepared FeRh@C (see Figs. 1a and 1c) [13]. Here, the low density (LD) sample counts approximately 1300 NPs per square micrometer while the high density (HD) one counts approx. 2200 NPs per square micrometer (see Tab. 1).
For the as-prepared LD sample, the size histogram obtained from the projected area and a Gaussian fit for the main monomer peak, leads to an over estimated equivalent circular D1 diameter centered on 7.6 nm with σD1 = 0.5 nm but also presents around 20% of dimers (D2) and 10% of trimers (D3) (see Fig. 1a and Tab. 1). Even if the picture in insert of Figure 1a, seems to present metastable inhomogeneous structures, High-Resolution TEM (HRTEM) images clearly reveal chains of fcc (A1) alloyed nanocrystals (see Fig. 2a) as for spherical FeRh@C with smaller sizes [7].
To reach the equilibrium phase, the FeRh@C samples have been annealed under UHV conditions at temperatures ranging from 500 to 700 °C and re-imaged to control TEM size histograms. Annealing systematically induces a morphology change to a more energetically favorable spherical shaped nanoparticles with apparent “reduced” D1 centered on 6.3 nm and σD1 = 0.4 nm for annealed LD sample (Fig. 1b and Tab. 1).
In agreement with bulk FeRh binary alloy in the range of Rh at. 48–56%, as estimated from Energy Dispersive X-Rays (EDX) experiments, HRTEM images evidence chemically ordered CsCl-type (B2) structure from UHV annealing at 500 °C for large clusters (Fig. 2c).
In order to increase the clusters' mean diameter by coalescence, we increase the NPs surface coverage. Note that for initial 7 nm-FeRh clusters with surface coverage from 3% to 20% the corresponding mean edge to edge distance between clusters is expected to decrease from 10 nm to zero [14].
For as-prepared and annealed HD cluster samples, we clearly see that the values of D2 and D3 peaks are centered at more than 10 nm with a marked increasing proportion due to a significant statistical multimer formation (Fig. 1c).
Moreover HD samples correspond to about 1 nm equivalent NPs thickness. The electron diffraction pattern from such a thick sample allows us to detect all the rings corresponding to the thermal structure evolution from the A1 chemically disordered FCC phase before annealing (Fig. 2b) with lattice parameter a = 3.77 Å (to compare to 3.736 Å for bulk A1 phase and 3.68 Å as predicted by Vegard's law) to the chemically ordered B2 cubic phase after annealing with lattice parameter a = 2.98 Å (see Fig. 2d) as in bulk FeRh cubic in AF state [15].
In order to describe the NPs shape, we determined the circularity (C) of their projected area and the corresponding aspect ratio (AR) of an ellipse fitted over this area using imageJ software [16]. Note that a low AR indicates that NPs prefer to spread in one orientation, while C is related to the proportion of perimeter versus area. So a high roughness of the perimeter induces a low circularity. These values are plotted in Figure 3 for as prepared (in blue) and annealed (in orange) samples with LD and HD. The schemes in Figure 4 illustrate possible NP shapes with different aspect ratio and their corresponding circularity.
For both densities, we clearly evidence that as-prepared samples have a large dispersion of shapes, while the circular and ellipse shapes become dominant upon annealing: B2 NPs become more spherical than the incident NPs. Moreover, since the number of nanoparticles per unit area does not decrease significantly after annealing, this means that the annealing processes affect more the nanoparticle shape than their coalescence.
For LD (resp. HD) samples, we obtain mean values of C = 0.55 (resp. C = 0.48) and AR = 0.54 (resp. AR = 0.55) before and C = 0.83 (resp. C = 0.80) and AR = 0.73 (resp. AR = 0.71) after annealing. By comparing these obtained results, we can notice that circularity and aspect ratio as monomer size (D1) are quite similar for both densities. The main difference is due to the percentage of D2 and D3+ NPs doubling from LD to HD which is responsible to the Dmean increasing and NN decreasing (see Tab. 1).
As a summary, we have been able to prepare chemically ordered cubic B2 nanoalloys with diameters larger than 10 nm from UHV 500–700 °C annealing by conserving nanogranular aspect until the 2D-percolation threshold.
To go further, we explore the thermal magnetic behavior of FeRh clusters with as large as possible diameter in order to overcome the critical size cross-over limit to observe AF order at low temperature.
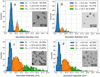 |
Fig. 1 Size histograms with N-Gaussian fit (black curves), separation of NPs population in monomers D1 (in blue), dimers D2 (in orange) and the rest for larger diameters as D3+ (in green) with corresponding % of NPs and TEM image in insert, for LD as prepared (a), LD annealed (b), HD as prepared (c) and HD annealed (d) large FeRh samples. |
TEM characteristic parameters obtained on as-prepared and annealed samples with low density (LD) and high density (HD) for monomer diameter (D1) and deviation (σ1) from Gaussian fit of size histogram, for mean size (Dmean) in the spherical approximation; for mean distances edge to edge between nearest neighbors (NN) and for density nanoparticles per area (ρ) from imageJ analysis.
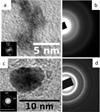 |
Fig. 2 High resolution TEM images of nanoparticles, with corresponding Fast Fourier Transform in insert (a and c) and electron diffraction pattern (b and d) before and after annealing, respectively. |
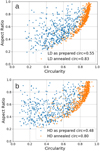 |
Fig. 3 Aspect ratio as function of the circularity for as prepared and annealed samples with low density (LD) and high density (HD). |
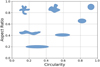 |
Fig. 4 Circularity and aspect ratio corresponding to the morphology of the observed NPs |
2.3 Magnetic properties
A total equivalent magnetic NPs thickness of about 2 nm is necessary for SQUID magnetometry (Quantum Design MPMS 5 XL). To achieve this, we prepare multilayers of FeRh cluster films with different surface coverage separated by carbon films as 7 nm-C spacers. The LD sample now consists of 15 alternate FeRh layers (each with only 0.13 nm thickness to limit magnetic interactions) while only 2 FeRh layers (each with 1 nm thickness) constitutes the HD sample. Then, we systematically investigate the same sample before and after annealing from SQUID magnetometry. Note that the diamagnetic response of the silicon substrate has been thoroughly characterized to correct all curves from its contribution.
From Cao et al., the temperature dependences of the magnetization of FeRh single crystal thin films grown on MgO substrates [17], showed that the amount of FM states starts to decrease at an annealing temperature of Ta = 500 °C and completely disappears at Ta = 700 °C. Therefore, these two annealing temperatures Ta (resp. 500 and 700 °C) have been chosen to progressively control the phase transition and coalescence in FeRh@C samples.
As for our structural study, we have compared the magnetic behavior of LD and HD samples. We use two different protocols to explore magnetic transitions: magnetization loops versus applied field m(H) at various temperatures and low-field susceptibility curves in the zero-field-cooling (ZFC) and field-cooling (FC) mode, with a 5 mT applied field. To investigate magnetic interactions, we perform isothermal remanant magnetization (IRM) together with direct-current demagnetization (DcD) curves at low temperature for both densities.
3 Results and discussion
3.1 Results on LD FeRh @C sample
We start by studying magnetic properties of LD FeRh@C samples. The magnetization curves m(H) acquired at 100 K and at 2 K are presented in Figure 5 before and after annealing up to 700 °C. First of all, one can notice that a weak ferromagnetism is observed for both as-prepared samples reversely to the bulk, where A1 phase is paramagnetic. Moreover, the effect of chemical ordering is clearly visible on magnetization curves but with a bit thermal difference. In one hand, mS is multiplied by four at 100 K for the B2 phase compared to the A1 phase, while it is only two times larger at 2 K (see Fig. 3). The coercive field Hc ∼ Keff/(μ0Ms) obtained at 2 K, is reduced in the same proportion as previously observed for 3 nm-size [8].
Nevertheless, once more, the FM order seems to be the main robust contribution well below room temperature in diluted large B2 NPs.
These results in favor of FM order are in agreement with spin-polarized DFT calculations and experimental results obtained by Liu et al. on well-faceted B2-ordered FeRh nanoparticles. They argued that facet competition which strongly privileges the Rh-terminated (100) facets over other facets, as they observed on one B2-FeRh NP with 8 nm-size, could explain the FM order persistence in nanocrystals [18]. From our part, TEM observations did not support such Rh-surface segregations for mass-selected FeRh clusters pre-formed in gas phase and protected by carbon coating. But once more, we can argue that carbon graphitization upon annealing favors demixing of C-atoms at interface and do not affect magnetism of FeRh NPs [9].
Moreover for both as-prepared and annealed LD samples, the ZFC/FC susceptibility curves show a crossover from the superparamagnetic to the blocked regime characteristic of FM NPs with a maximum ZFC temperature (Tmax) increasing from 20 K to 80 K upon annealing. Note that Tmax is connected to the energy barrier (ΔE = KeffV, with Keff being the effective anisotropy constant and V the magnetic volume) that macrospins have to overcome to switch from a favorable state to another one. By using the semi-analytical model presented in reference [19], we have been able to reproduce ZFC curve and a room temperature magnetization loop for the annealed LD sample with the set of parameters deduced from TEM (Fig. 6a). From simulations, we find that magnetic sizes with a majority of monomers (D1 = 6.3 nm) and of dimers (D2 = 8 nm), fit rather well both curves. The deduced effective anisotropy has been found around Keff = 120 kJ/m3, as previously obtained for B2 NPs with 3 nm-size, but with 40% anisotropy dispersion that could be related to a large number of possible configurations in nanoalloys [9].
As a conclusion, for the moment, we have not been able to clearly relate thermal m(H) differences to possible coexistence of AF/FM states. We assume that the LD samples probably contain too few nucleation sites of AF order which are highly sensitive to local strain and disorder [20]. We suspect that surface relaxation leading to a significant dispersion of local atomic distances, could be responsible to the main FM behavior in LD samples.
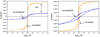 |
Fig. 5 Magnetization curves m(H) measured at 100K (left) and 2K (right) on LD FeRh@C nanoparticles embedded in C matrix before and after annealing up to 700 °C. |
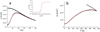 |
Fig. 6 ZFC/FC susceptibility curve and Hysteresis loops at 300 K for annealed LD (a) and HD (b) FeRh@C nanoparticles embedded in C matrix. The solid lines correspond to the fit. |
3.2 Results on HD FeRh @C sample
In order to increase shorter-range AF correlations, we have enlarged the NPs size by increasing the concentration of magnetic clusters in the matrix until the edge-to-edge mean distances fall in the range of the mean cluster diameter. However, by increasing the concentration of magnetic clusters in the matrix, the Stoner-Wohlfarth model of randomly oriented independent macrospins is no longer valid [21].
Nevertheless, from ZFC/FC susceptibility measurements on annealed samples, we always observe two superparamagnetic and blocked regimes but separated by a higher maximum temperature Tmax > 300 K for HD than for LD sample (see Fig. 6b). We have been able to reproduce the ZFC curve with an increased diameter of 7.4 nm and a large size dispersion σD = 3.4 nm, reflecting the important N-mers contributions. A reduced effective anisotropy of Keff = 100 kJ/m3 has been estimated but without true physical reality. From hysteresis loops m(H) measured on annealed samples at different temperatures, we also clearly evidence robust FM order down to 2 K for both densities. However, the in-plane saturation approach is more abrupt for HD at 300 K probably because of stronger magnetic interactions between NPs in HD than in LD samples (see Fig. 7). But surprisingly, the fact that the coercive field Hc measured at 2 K is only slightly higher for HD than for LD could be explained by a simultaneous reducing of Keff and ms values with possible AF contributions at low temperature. The comparison of IRM curves related to the switching fields in nanomagnets assembly, should give a good picture of the main anisotropy contribution and strength in both samples [22].
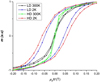 |
Fig. 7 m(H) measured at 2 K and 300 K on annealed LD and HD FeRh@C samples. |
3.3 Discussion on FeRh @C samples
We perform IRM/DcD remanant magnetization measurements at 2 K on both 3 h annealed FeRh@C samples at 700 °C, in order to qualitatively correlate cluster concentrations and magnetic interaction effects from the deviation to zero of Δm = DcD(H)-(IRM(∞)-2IRM(H)) [22].
Even if there is no simple theoretical description for interacting nanoparticle assemblies, negative Δm term is generally attributed to dipolar interactions between separated nanomagnets. On the contrary, exchange correlations between NPs in direct contact have negligible effects on Δm curves [22].
We have found strong demagnetizing negative Δm/mr ratios higher than 10% for both clusters concentrations (see Fig. 8). By referring to TEM observations, we found that for LD samples the proportion of N-mers decrease after annealing and the mean distance increase between FeRh clusters. This leads to high dipolar interactions for the LD sample. While there is more multimers in the as-prepared HD sample, in favour of direct exchange interactions upon annealing. This could explain why: Δm (LD) > Δm (HD).
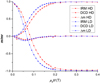 |
Fig. 8 IRM/DcD and Δm curves measured at 2 K on annealed LD and HD FeRh@C samples. |
4 Conclusion
In this paper, we have prepared FeRh equiatomic nanocrystallites as-large as possible from M-S LECBD in order to favor the expected metamagnetic phase transition. Even if we have obtained A1/B2 chemical order transition with similar bulk alloy structure for NP FeRh with diameter as larger as 10 nm, very different and intricate thermal magnetic behaviors have been evidenced at nanoscale. In particular, to understand why the AF order expected at low temperatures remains elusive at nanosize, we propose possible explanations based on the co-existence of dipolar and direct exchange magnetic interactions between NPs but also based on the competition between several magnetic orders in nanoalloys as SP states, metastable FM and uncompensated magnetic moments due to symmetry breaking at surface which are inherent size effects to AF NPs [23].
In a near future, other ways should be explored as denser NPs assemblies, strain or voltage to try to control the magnetism of such nanomagnets [24].
Author contribution statement
This experimental work is part of the PhD thesis of A. Robert and G. Herrera supervised by A. Tamion and V. Dupuis who extensively participate to the writing of the manuscript. The synthesis and characterization experiments, the data analysis and interpretation of the results were performed thanks to the participation of all the authors G. Herrera, A. Robert, V. Dupuis, N. Blanchard, O. Boisron, C. Albin, L. Bardotti, D. Le Roy, F. Tournus and A.Tamion who discussed by consensus the results and commented the manuscript.G. Herrera and V. Dupuis revised the manuscript.The authors declare no competing financial interests.
Acknowledgments
The authors are very grateful to ILMTECH platform for clusters synthesis at PLYRA and SQUID measurements at CML. Support is acknowledged from the IRN Nanoalloys (CNRS).
This work is the starting point of the VOLCONANO ANR-19-CE09-0023 collaborative project including the (G.H.) co-supervised PhD grant in progress.
References
- T. Blachowicz, A. Ehrmann, Molecules 25, 2550 (2020) [CrossRef] [Google Scholar]
- P. Andreazza, V. Pierron-Bohnes, F. Tournus, C. Andreazza-Vignolle, V. Dupuis, Surf. Sci. Rep. 70, 188 (2015) [CrossRef] [Google Scholar]
- F. Tournus, K. Sato, T. Epicier, T.J. Konno, V. Dupuis, Phys. Rev. Lett. 110, 055501 (2013) [CrossRef] [PubMed] [Google Scholar]
- C. Antoniak, M. Spasova, A. Trunova, K. Fauth, F. Wilhelm, A. Rogalev, J. Minar, H. Ebert, M. Farle, H. Wende, J. Phys. : Condens. Matter 21, 336002 (2009) [CrossRef] [PubMed] [Google Scholar]
- N. Blanc, L.E. Diaz-Sanchez, A.Y. Ramos, F. Tournus, H.C.N. Tolentino, M. De Santis, O. Proux, A. Tamion, J. Tuaillon-Combes, L. Bardotti, O. Boisron, G.M. Pastor, V. Dupuis, Phys. Rev. B 87, 155412 (2013) [CrossRef] [Google Scholar]
- V. Dupuis, N. Blanc, L. Diaz-Sanchez, A. Hillion, A. Tamion, F. Tournus, A. Rogalev, F. Wilhelm, G.M. Pastor, Eur. Phys. J. D 67, 25 (2013) [CrossRef] [Google Scholar]
- V. Dupuis, N. Blanc, L. Diaz-Sanchez, A. Hillion, A. Tamion, F. Tournus, G.M. Pastor, Eur. Phys. J. B 86, 1 (2013) [CrossRef] [Google Scholar]
- B. McGrath, R. Camley, K. Livesey, Phys. Rev. B 101, 014444 (2020) [CrossRef] [Google Scholar]
- A. Hillion, A. Cavallin, S. Vlaic, A. Tamion, F. Tournus, G. Khadra, J. Dreiser, C. Piamonteze, F. Nolting, S. Rusponi, K. Sato, T.J. Konno, O. Proux, V. Dupuis, H. Brune, Phys. Rev. Lett. 110, 087207 (2013) [CrossRef] [PubMed] [Google Scholar]
- V. Dupuis, A. Robert, A. Hillion, G. Khadra, N. Blanc, D. Le Roy, F. Tournus, C. Albin, O. Boisron, A. Tamion, Beilste J. Nanotechnol. 7, 1850 (2016) [CrossRef] [Google Scholar]
- F. Tournus, N. Blanc, A. Tamion, M. Hillenkamp, V. Dupuis, J. Magn. Magn. Mater. 323, 1868 (2011) [CrossRef] [Google Scholar]
- Patent Number WO/ 2014 /191688 [Google Scholar]
- R. Alayan, L. Arnaud, M. Broyer, E. Cottancin, J. Lermé, J.L. Vialle, M. Pellarin, Phys. Rev. B 73, 125444 (2006) [CrossRef] [Google Scholar]
- F. Tournus, J. Nanopart. Res. 13, 5211 (2011) [CrossRef] [Google Scholar]
- M. Loving, M.A. de Vries, F. Jimenez-Villacorta et al., J. Appl. Phys. 112, 043512 (2012) [CrossRef] [Google Scholar]
- W.S. Rasband, ImageJ, U.S. National Institutes of Health, Bethesda, Maryland, USA, 1997−2018 [Google Scholar]
- J. Cao, N.T. Nam, S. Inoue, H.Y.Y. Ko, N.N. Phuoc, T. Suzuki, J. Appl. Phys. 103, 07F501 (2008) [CrossRef] [Google Scholar]
- M. Liu, P. Benzo, H. Tang, M. Castiella, B. Warot-Fonrose, N. Tarrat, C. Gatel, M. Respaud, J. Morillo, M.J. Casanove, EPL 116, 27006 (2016) [CrossRef] [EDP Sciences] [PubMed] [Google Scholar]
- A. Tamion, M. Hillenkamp, F. Tournus, E. Bonet, V. Dupuis, Appl. Phys. Lett. 95, 062503 (2009) [CrossRef] [Google Scholar]
- V. Uhlíř, J.A. Arregi, E.E. Fullerton, Nat Commun. 7, 13113 (2016) [CrossRef] [Google Scholar]
- A. Hillion, A. Tamion, F. Tournus, C. Albin, V. Dupuis, Phys. Rev. B 95, 134446 (2017) [CrossRef] [Google Scholar]
- F. Tournus, A. Tamion, A. Hillion, V. Dupuis, J. Magn. Magn. Mater. 419, 1 (2016) [CrossRef] [Google Scholar]
- D.A. Balaeva, A.A. Krasikov, S.I. Popkov, S.V. Semenov, M.N. Volochaev, D.A. Velikanov, V.L. Kirillov, O.N. Martyanov, J. Magn. Magn. Mater. 539, 168343 (2021) [CrossRef] [Google Scholar]
- I. Fina, J. Fontcuberta, J. Phys. D: Appl. Phys. 53, 023002 (2020) [CrossRef] [Google Scholar]
Cite this article as: Guillermo Herrera, Anthony Robert, Veronique Dupuis, Nicholas Blanchard, Olivier Boisron, Clement Albin, Laurent Bardotti, Damien Le Roy, Florent Tournus, Alexandre Tamion, Chemical and magnetic order in mass-selected large FeRh nanomagnets embedded in a carbon matrix, Eur. Phys. J. Appl. Phys. 97, 32 (2022)
All Tables
TEM characteristic parameters obtained on as-prepared and annealed samples with low density (LD) and high density (HD) for monomer diameter (D1) and deviation (σ1) from Gaussian fit of size histogram, for mean size (Dmean) in the spherical approximation; for mean distances edge to edge between nearest neighbors (NN) and for density nanoparticles per area (ρ) from imageJ analysis.
All Figures
|
Fig. 1 Size histograms with N-Gaussian fit (black curves), separation of NPs population in monomers D1 (in blue), dimers D2 (in orange) and the rest for larger diameters as D3+ (in green) with corresponding % of NPs and TEM image in insert, for LD as prepared (a), LD annealed (b), HD as prepared (c) and HD annealed (d) large FeRh samples. |
| In the text | |
|
Fig. 2 High resolution TEM images of nanoparticles, with corresponding Fast Fourier Transform in insert (a and c) and electron diffraction pattern (b and d) before and after annealing, respectively. |
| In the text | |
|
Fig. 3 Aspect ratio as function of the circularity for as prepared and annealed samples with low density (LD) and high density (HD). |
| In the text | |
|
Fig. 4 Circularity and aspect ratio corresponding to the morphology of the observed NPs |
| In the text | |
|
Fig. 5 Magnetization curves m(H) measured at 100K (left) and 2K (right) on LD FeRh@C nanoparticles embedded in C matrix before and after annealing up to 700 °C. |
| In the text | |
|
Fig. 6 ZFC/FC susceptibility curve and Hysteresis loops at 300 K for annealed LD (a) and HD (b) FeRh@C nanoparticles embedded in C matrix. The solid lines correspond to the fit. |
| In the text | |
|
Fig. 7 m(H) measured at 2 K and 300 K on annealed LD and HD FeRh@C samples. |
| In the text | |
|
Fig. 8 IRM/DcD and Δm curves measured at 2 K on annealed LD and HD FeRh@C samples. |
| In the text | |
Current usage metrics show cumulative count of Article Views (full-text article views including HTML views, PDF and ePub downloads, according to the available data) and Abstracts Views on Vision4Press platform.
Data correspond to usage on the plateform after 2015. The current usage metrics is available 48-96 hours after online publication and is updated daily on week days.
Initial download of the metrics may take a while.