Fig. 1
Download original image
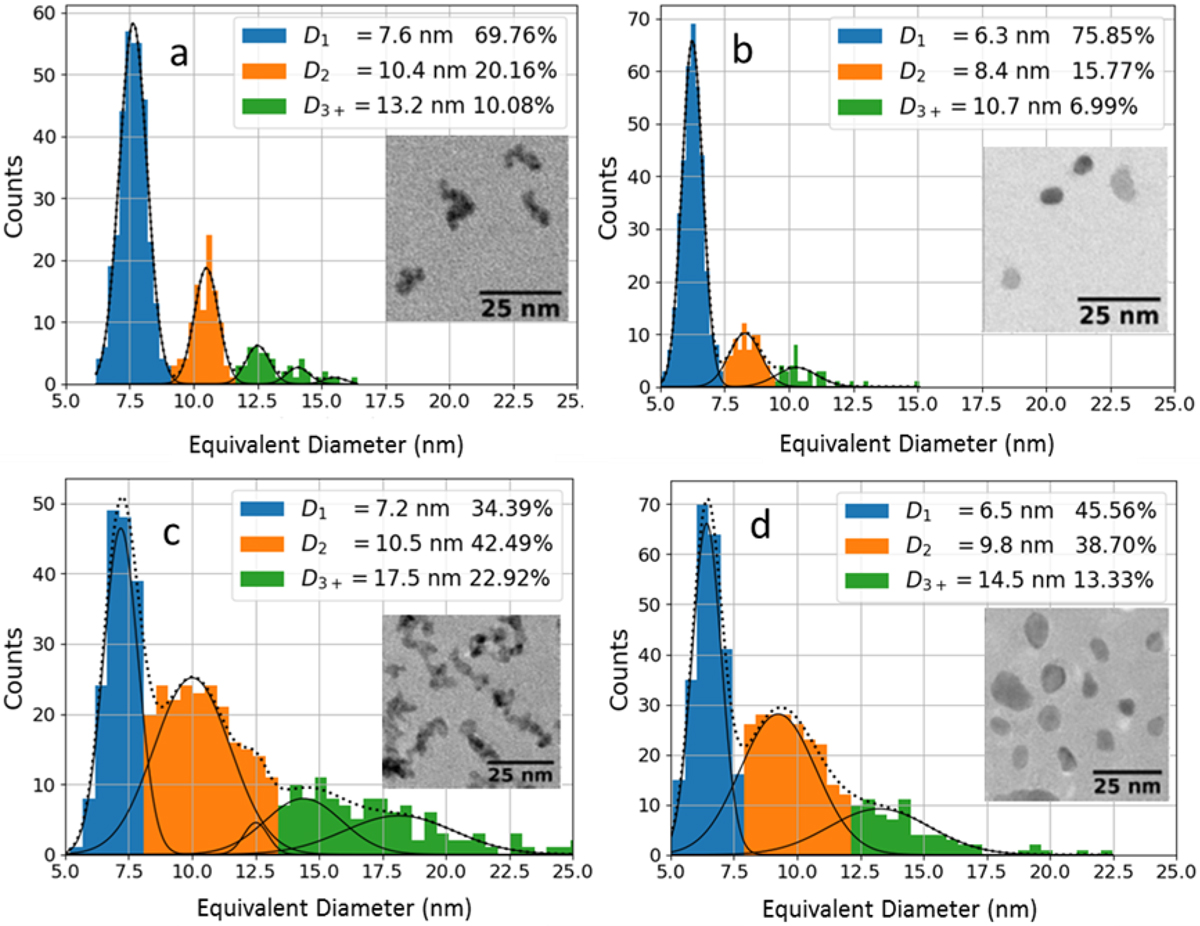
Size histograms with N-Gaussian fit (black curves), separation of NPs population in monomers D1 (in blue), dimers D2 (in orange) and the rest for larger diameters as D3+ (in green) with corresponding % of NPs and TEM image in insert, for LD as prepared (a), LD annealed (b), HD as prepared (c) and HD annealed (d) large FeRh samples.
Current usage metrics show cumulative count of Article Views (full-text article views including HTML views, PDF and ePub downloads, according to the available data) and Abstracts Views on Vision4Press platform.
Data correspond to usage on the plateform after 2015. The current usage metrics is available 48-96 hours after online publication and is updated daily on week days.
Initial download of the metrics may take a while.