| Issue |
Eur. Phys. J. Appl. Phys.
Volume 95, Number 3, September 2021
|
|
|---|---|---|
| Article Number | 30801 | |
| Number of page(s) | 11 | |
| Section | Plasma, Discharges and Processes | |
| DOI | https://doi.org/10.1051/epjap/2021210110 | |
| Published online | 03 September 2021 | |
https://doi.org/10.1051/epjap/2021210110
Regular Article
Experimental investigations of a remote atmospheric pressure plasma by electrical diagnostics and related effects on polymer composite surfaces
1
IRT Saint-Exupéry, 31400 Toulouse, France
2
LAPLACE, Université de Toulouse, CNRS, INPT, UPS, 31062 Toulouse, France
* e-mail: This email address is being protected from spambots. You need JavaScript enabled to view it.
Received:
18
May
2021
Received in final form:
24
July
2021
Accepted:
13
August
2021
Published online: 3 September 2021
Abstract
Surface activation of Carbon Fiber Reinforced Polymers (CFRP) using (Poly-EtherEtherKetone) (PEEK) matrices is required to achieve strong and long-term adherent painting on the composite. Among the different techniques, an industrial atmospheric pressure remote plasma has been used in this work to treat PEEK CFRP surfaces. The characterization of this device by means of electrical diagnostics related to the effect of such post-discharge on the surface modifications is discussed. Firstly, electrical characteristics of the discharge show fairly high currents associated to high voltages which suggest a nonestablished and cold arc. Power consumed by the electrical supply associated to post-discharge length and surface temperatures allowed a better understanding of the industrial device. Secondly, the effects of plasma on surface chemistry and topography are analyzed by water contact angle measurements, X-ray Photoelectron Spectroscopy (XPS) and Atomic Force Microscopy (AFM). Investigations showed that treated surfaces exhibited better hydrophilicity mainly due to an incorporation of oxygen containing groups (up to 8.4% more) under air plasma whereas an increase of the nanoroughness and specific surface is preponderant under nitrogen plasma. Different hydrophilic capabilities of the surface obtained in air and nitrogen gas plasmas highlight a potential optimization of activation performances according to industrial specification.
© L. Brès et al., Published by EDP Sciences, 2021
 This is an Open Access article distributed under the terms of the Creative Commons Attribution License (https://creativecommons.org/licenses/by/4.0), which permits unrestricted use, distribution, and reproduction in any medium, provided the original work is properly cited.
1 Introduction
Carbon Fiber Reinforced Polymers (CFRP) using thermoplastic polymer matrices are increasingly being used in structural engineering, particularly in aeronautics, due to their low weight coupled with high mechanical properties [1–3]. Poly-EtherEtherKetone (PEEK) matrices composites are especially interesting because of their excellent physical and chemical properties, including high thermal stability, high chemical resistance and their ability to withstand high mechanical loads [4]. In most applications, the adhesive bonding or the coatings of these composites is required [5,6]. However, the low surface energy and the high chemical resistance of PEEK CFRP imply to develop surface activation processes aiming at increasing their surface reactivity before coating. Among them, processes using atmospheric pressure cold plasma have shown to be effective processes to improve wettability and surface energy on such composites [7,8]. Moreover, this technology attracts the attention of many aerospace companies looking for a low cost and an environment-friendly surface activation process [9,10]. The possible implementation of an Atmospheric Pressure Plasma (APP) process in a production line without significant changes is also an advantage for its deployment.
Among the various ways of generating plasma under atmospheric pressure, the most widespread are certainly the Dielectric Barrier Discharges and their application in promoting adhesion or printability of films under air plasma, also known as Corona discharges treatments [11,12]. The main advantages of such configurations are exploited in automotive and large-scale products industries. The very nonequilibrium plasma generated can easily treats large two-dimensions surfaces in very short process time [13,14]. However, treated materials have to be flat and thin in order to get the breakdown of the gas at atmospheric pressure in the small space between the electrodes [15]. To overcome this strong limitation, Atmospheric Pressure Plasma Jets (APPJ) are particularly interesting since the gas flow extends the plasma region beyond the electrodes space. Created medium is so called post-discharge or remote plasma and contains actives species which will be responsible for surface modifications [16,17]. Indeed, efficiency of such configuration is widely confirmed in the literature [18,19]. Using of air or nitrogen gas leads to an incorporation of oxygenated groups or nitrogen-containing groups respectively. This chemical effect may be considered in a synergistic work with the surface etching caused by the impact of reactive species [20]. Among the wide range of APPJ devices for industrial purposes, challenges remain in correlating the surface modifications to the physics of the discharge. For example, Kostov et al. [21] provide good clues in optimizing process parameters of an Argon APPJ while considering gas flow dynamics and distribution of the reactive species in the post-discharge.
In the context of this study, industrial PEEK composites are characterized prior to and after activation by a remote APP, UL-SCAN from AcXys Technologies© [22]. Two different gas carriers, air and nitrogen, are used to generate the plasma. Chemical composition and morphological effect are investigated with respect to surface wettability. An electrical study of the power consumed by the power supply is done in order to correlate this latter parameter to the physical behavior of the remote plasma and its physical characteristics.
2 Experimental details
This part is dedicated to the description of the plasma device used in this study. Several parameters can be tuned in order to adjust the physical plasma characteristics of the APP and its effects on the surface modifications. Hereafter are detailed diagnostics tools of the device, including the discharge and the post-discharge, and surface characterization techniques used.
2.1 UL-SCAN device description
The experimental set-up consists of an industrial arc plasma torch UL-SCAN supplied by AcXys Technologies© which is operated at ambient air and atmospheric pressure. The system is driven by an alternating current power supply based on a resonant power supply with a resonance frequency not known but inferior to 80 kHz which is the minimal value. Therefore, the highest discharge power is obtain for 80 kHz and decreases with the increase of the frequency up to 200 kHz, which is the maximal value. The power supply is made of a DC/AC converter and it contains a series of inductances and capacitances. Displacement of the torch is ensured by a directional nozzle mounted on a 3-axes robot that scans the surface to be treated line by line. Distance between each line is called the step. In this work, it is fixed to 5 × 10⁻⁴ m whereas the scan speed is set to 0.3 m/s, which is the maximal value allowed by the robot.
Discharge is obtained by the breakdown of a gas flowing between two electrodes (Fig. 1). The inner electrode connected to the high voltage is of cylindrical shape whereas the outer one is placed coaxially to the first and connected to the ground. Created arc is located at the end of the high voltage electrode on one side and moves along the outer electrode at the other side. An afterglow region over a few centimeters, namely the post-discharge in Figure 1, is created at the outlet of the nozzle which is directed toward the sample. It contains reactive species like metastables, neutrals and radicals but avoids ionized species. Activation performances can be promoted by tuning three process parameters underlined in Figure 1: the electrical power consumed by the power supply, the nozzle/substrate distance (named gap hereafter) and the scan speed. These process parameters determine three main physical characteristics of the remote plasma, noted in italics: the electrical power transferred to the discharge Pd, the length of the post-discharge and the temperature experienced by the substrate. All these process parameters allow operator maximizing the effect and improving homogeneity of the treatment while preventing some degradations on the sample surface.
The discharge is under nonlocal thermodynamic equilibrium, so the plasma produced is a cold one. Hence, electrodes do not need an external cooling system and their erosion is limited. The working gas can be either dry (dew point temperature <3 °C), oil free (oil residues <0.01 mg/m3) and compressed filtered air (from particles <0.1 μm) or compressed nitrogen (99.9998% of purity, Air Liquide®). The same inner electrode is used to perform all the characterization tests.
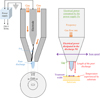 |
Fig. 1 Schematic of the experimental device UL-SCAN and process parameters. |
2.2 Surface characterizations
Activations with the remote APP described above are done on industrial CFRP with a PEEK matrix. It is in autoclave manufactured, constituted of several carbon plies between two glass plies so that the top surface is mainly constituted by PEEK matrix. The composite shows a visually planar surface, slightly rough and is around 2 × 10⁻³ m thick. Surfaces could have a lot of pollution such as drilling and cutting lubricants and other contaminants due to manufacturing processes. In order to get reproducible initial surfaces before characterization or activation, samples are manually cleaned three times by moistened wipes of propylene glycol methyl ether (Diestone DLS from SOCOMORE®) in accordance with no visual pollution on wipes by the end of the cleaning process.
Surface wettability studied by contact angle measurements are carried out by analyzing static sessile drop. A portable dosing instrument called the Mobile Surface Analyzer (MSA) developed by KRUSS® is used. Characteristics of the pure liquids are presented in Table 1. The polar one is deionized water and the apolar one is diiodométhane (CH2I2).
The Owens-Wendt-Rabel-Kaelble theory [24] is used to determine surface free energy (γS) of samples and discriminate the polar component (γSP) from the dispersive component (γSD), measuring the contact angle θ of pure liquids on substrate, see (1).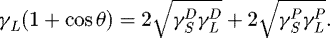 (1)
(1)
For each individual sample, repeatability is checked by analyzing 3 drops with each liquid at room temperature, 5 seconds after liquid deposition.
Chemical analysis of less than 10 nm depth is performed by a Kratos® Nova X-Ray Photoelectron Spectrometer (XPS) using a monochromatic Al Kα source and a normal angle detection from the substrate (θ = 0°). The analysis is performed under a vacuum of approximatively 10−9 Torr. Surface of 300 μm × 700 μm is irradiated at the center of the sample. Binding energies of spectra are corrected using the C = C bond of C1s peak at 284.7 eV. The standard deviation of the concentration is 0.1%.
The nanoroughness is evaluated using a multimode Nanoscope V microscope (Atomic Force Microscopy, AFM) from Bruker®. The Peak Force mode at ambient air is selected to scan the surface of composites. The spring constant of the TESPA probes used is 42 N/m and the tip radius is about 8 nm. The Nanoscope analysis software permits to analyze the topographical images and extract the nanoroughness Ra and the image specific surface area Sw, chosen as the two representative parameters. The former represents the arithmetical mean roughness of the analyzed surface. The latter is expressed as the additional surface area which contributes to the texture compared to the analyzed surface. Ra and Sw are calculated from an average of three 5 μm × 5 μm images.
2.3 Discharge diagnostics
The discharge is characterized by means of electrical measurements whereas the post-discharge is investigated by mean of optical and temperature measurements. The voltage U(t) is measured using a high voltage probe (Tektronix® P6015A) connected to the output of the power supply. The current I(t) delivered by the power supply is measured using a current probe (Model 4100 Pearson Electronics®). These electrical measurements are monitored using a Teledyne Lecroy® oscilloscope (WaveSurfer 3024 200MHz; 4GS/s). The measured power Pd over a period t at the output of the power supply is calculated using (2). (2)
(2)
Pictures of the post-discharge are taken by a digital camera (CANON® EOS 100d) to monitor its shape and its size.
Finally, temperature measurements under the post-discharge are done using thermocouple 80PK-1 (–40 °C to 260 °C) connected to a thermometer Fluke® (P568). The thermocouple is placed under the post-discharge during an activation, in the position than the sample to simulate a treatment. Results represent the temperature to which the material is exposed during activation.
3 Results and discussions
Power Pd dissipated at the output of the power supply Pd associated to some physical post-discharge characteristics, like its dimensions and temperatures, are investigated under air and nitrogen plasmas. On this basis, it appears meaningful to characterize effect of the post-discharge on the surface from both topological and chemical perspectives. Finally, instabilities of the discharge are highlighted at high device power which are ascribed to different arc behaviors.
3.1 Scope and approach of the study
APPJ industrial devices can generally be settled by various parameters in order to meet special requirements of production line and adjust activation to the size and the shape of the treated parts. UL-SCAN device used in this study satisfies the rules and can be tuned by a few parameters as described in Section 2.1. It is therefore necessary to understand the relation between each process parameter noted in Figure 1 and their influence on the post-discharge during activation. Indeed, in the UL-SCAN device, some of them are cross-linked, making the study of their individual influence more complicated. From the experiment, it can be said that the frequency coupled to the gas flow rate determine the electrical power Pa consumed by the power supply. The latter combined with the gap give a treatment width after one single strip of the torch. Finally, by determining an efficient treatment width and selecting the scan speed of the post-discharge above the substrate, an interaction time can be estimated between reactive species of the remote plasma and the substrate.
The aim of this study is to enhance knowledge of mechanisms which can be led to an improvement of surface energy and hence, a better paint adhesion. However, to give greater meaning to the surface characterization data, discharge and post-discharge are carefully analyzed in order to quantify three physical characteristics of the remote plasma, noted in italic in Figure 1. These are the length of the post-discharge, the temperature experienced by the substrate during activation and the power really transferred to the discharge Pd.
3.2 Electrical diagnostics of the discharge
The power supply of the UL-SCAN torch delivers quasi-sinusoidal waveforms of current and voltage. Figure 2 shows electrical oscillogram of the arc with the highest frequency (200 kHz) and the lowest gas flow rate (30 slm). Usually, nonthermal plasmas at atmospheric pressure under air or nitrogen gas are characterized by low currents around a few mA and high voltages of a few kV [25]. In contrast, thermal plasmas are characterized by high currents (a few A or higher) and low voltages (a few tens of V). In the case of the UL-SCAN torch, fairly high currents and high voltages are measured, which indicates that the arc is not very powerful in contrast to dc-driven plasma torch [26]. Indeed, thermal plasmas can be obtained in nonlocal thermodynamic equilibrium if the power dissipated in the gas plasma is limited by an AC-driven source before thermalization of the gas [27]. As already mentioned, this solution offers the advantage of not needed to be cooled.
In fact, due to the high frequency excitation, the arc is constantly extinguished before its full establishment between electrodes. Then, the gas temperature in the post-discharge remains much lower than electrons temperature and close to ambient temperature. Consequently, it is possible to activate thermo-sensitive substrates [21,28].
The man-machine interface gives to the operator the real-time power consumed by the power supply, named Pa and expressed in Watt. However, this value is measured in the DC bus and, as additional losses could exist between the power supply and the electrodes, Pa could be different from the power dissipated Pd. Figure 3 shows evolution of Pa and Pd for an air and a nitrogen discharges according to the gas flow rate and the frequency of the electrical signal. Comparisons between these two powers are done in order to quantify the conversion efficiency of the system. It is calculated from the ratio of the output power, Pd, by the input electrical power, Pa.
In both gas plasma, Figure 3 shows that the power increases when increasing the gas flow. On the other side, increasing the frequency results in a decrease of the power. This latter phenomenon is due to the power supply itself. As explained in the experimental parts, its resonant frequency is inferior to 80 kHz. Then, if the frequency increases, the voltage amplitude decreases and hence the discharge power decreases too. Comparison of Pd range values between air and nitrogen indicates a higher power dissipated in nitrogen discharge (from 1050 to 1550 W) compared to air discharge (from 750 to 1350 W).
Despite these differences, the conversion efficiency of both discharges is similar. It is equal to 91 ± 4% using air and to 98 ± 3% using nitrogen. These values, including their standard deviations which are explained by the uncertainty measurements, are those expected for a resonant power supply. Based on this linear relation between Pa and Pd, an approximation can be done for the rest of the study. Following discussions will use the power consumed by the electrical power supply Pa.
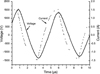 |
Fig. 2 Typical current (–) and voltage (—) time evolution of the UL-SCAN power supply under air plasma at 200 kHz and 30 slm. |
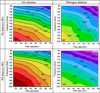 |
Fig. 3 Abacus of the calculated power transferred to the discharge (Pd) and the power consumed by the electrical supply (Pa) under air and nitrogen plasmas, according to frequency and gas flow rate. |
3.3 Study of the physical plasma characteristics according to the power
Previous paragraph has shown that the discharge power depends on the gas used and its flow rate. Physical plasma characteristics as the post-discharge length can be expected to vary according to the power and thus influences activation performances. Therefore, next paragraphs will analyze the post-discharge length and the temperature experienced by the substrate during treatment.
3.3.1 Post-discharge length
Obviously, the post-discharge length is an important factor for the understanding of the process because contact area between post-discharge and substrate depends on it. Figure 4a represents typical post-discharge profiles obtained by a digital camera for a plasma sustained under nitrogen (left) and air (right) gas. By comparing their sizes at the same device power of 1235 W and 60 slm gas flow rate, using air gas leads to a longer post-discharge and thus, as a crude approximation, to a fewer loss of active species by radiative recombination. This first observation is plotted in Figure 4b showing the evolution of the post-discharge length according to the device power. In this case, the gas flow rate fluctuates from 30 (lower points) to 60 slm (upper points) as illustrated by the solid arrow. One can note that by increasing the device power, the post-discharge length also increases in the same proportions under air or nitrogen plasma. For the same power and gas flow, the post-discharge length is always longer under air than under nitrogen gas.
It can be easily understood that these post-discharge differences according to the power determine the choice of the gap parameter described in Figure 1. This parameter is therefore set in this study in order to make reliable comparisons of post-discharge effects on the substrate. An intermediary gap value of 0.027 m is chosen between substrate and the nozzle. It has been determined based on contact angle measurements in order to get a wide variation of the water contact angle θwater and the surface free energy γs.
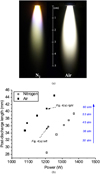 |
Fig. 4 (a) Photographs of an air (right) and nitrogen (left) post-discharge at 1235 ± 15 W and 60 slm gas flow rate. (b) Evolution of the post-discharge length in both gas plasmas. |
3.3.2 Gas temperature under the post-discharge
The less important radiative relaxations highlighted under nitrogen plasma reflects a greater conservation of the active species in the post-discharge and probably a lesser amount of heat transfers with ambient air. One way to estimate the temperature at which the PEEK treatment occurred is to place a thermocouple under the post-discharge and to perform an activation under various device powers. Figure 5 gives the maximal temperature measured during the passage of the torch for three fixed gaps of 0.015, 0.027, and 0.045 m.
By comparing the value range of temperature read by the thermocouple, both air and nitrogen plasmas lead to temperatures between 40 °C and 130 °C. It is less than the Glass Temperature Tg of the PEEK matrix which is 143 °C at 25 °C according to the technical data sheet of the industrial composite. Triangle points, round circles and square points which represent temperatures measured at 0.045, 0.027, and 0.015 m gap respectively show a linear evolution according to the device power, independently of the gas plasma used. These consistent values suggest an air post-discharge slightly colder than the nitrogen one, due to lower power of the discharge (Fig. 3).
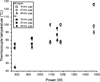 |
Fig. 5 Evolution of temperature experienced by the substrate during activation. |
3.4 Chemical and physicochemical characterizations according to device power in both gas plasma
Electrical and optical diagnostics of the UL-SCAN device associated to surface temperature measurements indicate different features of the plasma depending on the gas used. As mentioned before, the first difference observed is the post-discharge length which may impact the surface temperature of PEEK matrix. It is known that an increase of the surface temperature could have a significant impact on surface modifications by atmospheric pressure plasma [28]. In the specific application of polymers, this parameter is important to consider in order to avoid any degradations of the thermo-sensitive matrix. The post-discharge of the UL-SCAN device has a limited interaction time with the composite surfaces since the torch moves during activation. Its scan speed can reach 0.3 m/s thus enabling an optimization of the power dissipated onto the surface (as previously mentioned, in this work this scan speed has been set at 0.3 m/s). To ensure an activation without long-range damaging of the PEEK matrix, some characterizations of the surface after plasma are made. Hydrophilic properties of substrate are first characterized by contact angle measurements, and, in a second time, results are correlated with chemical composition of the top layer. Finally, morphological analyses are performed.
At initial state, industrial PEEK composites used in this study have a poor total surface energy (53 mN/m) associated to a rather high water contact angle (68°). It is known from the literature that PEEK matrix is usually considered as quite inert and hydrophobic when applying a coating without any activation [29]. This low reactivity is a combination of its relative chemical inertness, due to the three aromatics rings in the polymer unit, with its low roughness (3.7 nm for the composite studied). These characteristics result in a poor adhesion and ageing with the coatings as already shown in the literature [18,30].
Figure 6 shows the evolution of Surface Free Energies (SFE) under air plasma and nitrogen plasma according to device power Pa. SFE have been measured after activation gas flow rate of 30, 45, and 60 slm. Once activated by air plasma (filled squares), industrial PEEK substrates show a significant increase in its surface free energy. The dispersive component (not shown here) decreases slightly from 44 to 35 mN/m whereas the polar component presents a substantial increase from 7 to 39 mN/m. Moreover, these trends are more pronounced with increasing device power until an asymptote is reached for high power values.
These results illustrate an improvement of hydrophilic character by air plasma activation which can be attributed to the increase of the polar component. However, a different behavior of the wettability under nitrogen plasma is illustrated by empty squares in Figure 6 (nitrogen plasma activation). Whatever the device power during the treatment or the gas flow rate, neither surface free energy nor water contact angle (reaching a plateau of 74 ± 2°) are varying. The dispersive component of the surface free energy (not shown here) stays around the initial value, 44 ± 4 mN/m and the polar one is about 29 ± 3 mN/m, which is still much higher than the initial value of 7 mN/m. An asymptotic plateau is immediately reached, which could be explained by a saturation in surface hydrophilic capabilities.
In order to discuss about the improvement of surface polarity, XPS measurements are carried out on untreated and treated industrial PEEK surface in both gas plasma. Table 2 gives the atomic percentages of carbon, oxygen and nitrogen measured in extreme surface. Calculations based on this XPS data show an increase in the atomic percentage of oxygen from 13.5 to 21.5% at 1320 W under air plasma and to 20.4% at 1530 W under nitrogen plasma. It indicates an oxygen enrichment of the surface in both gas plasma also described in [30], which is in accordance with the surface polarity improvement seen in Figure 6. Due to the electronegative behavior of the oxygen atom, the increase of its surface density induces an enhancement of the hydrophilic character. The increase of the device power contributes to a weak increase of the oxygen concentration on the PEEK surface, ranging from 19% at low device power, to 21.5% at high device power. In their work, Van Deynes et al. [31] noticed a less efficient grafting of oxygen containing groups at high gas flow due to a turbulent flow in an Argon afterglow. As described in the experimental part, the UL-SCAN device allows the operator to activate substrate under rather high gas flow rates (from 30 to 60 slm). It could explain the little changes of oxygen concentrations during air plasma activation.
In the case of the nitrogen plasma, it is interesting to note that the concentration of nitrogen atom on the surface is always below 1% and does not vary with the device power. In fact, this concentration is nearly the same than those measured in air for the highest device power. As the nitrogen post-discharge is obtained in ambient air, the incorporation of oxygen comes from ambient air in post-discharge leading to an increase of the oxygen concentration in the post-discharge. Moreover, due to its high flow rate, turbulences could also appear near the substrate creating recirculation phenomena and bringing more oxygen and impurities [32].
These XPS investigations show a very good signature of industrial PEEK surface, even after high device power activation. Shake-up and C = C bond peak (not shown here) corresponding to aromatic rings are still visible under these severe conditions. From that perspective, no damages in long range scale is pointed out which is in concordance with the modifications depth calculated in paragraph 2.2 from the detection angle of analysis (less than 10 nm).
Previous parts of this study have shown that the major chemical modifications after UL-SCAN treatment is related to the atomic percentage of oxygen and carbon. It is therefore worth considering which kind of chemical functions are grafted and in which proportions by realizing deconvolution of the spectra. Figure 7 represents the grafting ratio calculated from the C1s peak that is basically the sum of the four contributions related to grafting phenomena, namely C–O (C–N) at 285.8 eV, C = O (N–C = O) at 287.2 eV, O–C = O at 288.8 eV, and CO3 at 290.0 eV. The increase of these contributions with the plasma power, either under air or nitrogen gas, confirms the incorporation of oxygenated functional groups, in lesser amount.
This PEEK surface oxidation may encourage strong bonds with coatings [20]. However, atmospheric pressure plasmas are also known to significantly modify the substrate roughness [31]. The next paragraph will give some results on topographical modifications after activation by UL-SCAN.
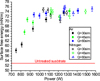 |
Fig. 6 Surface free energy evolution calculated by OWRK method according to device power under air and nitrogen plasmas. Q represents the gas flow rate. |
Atomic percentages of oxygen, carbon and nitrogen determined by XPS analysis prior to and after activation.
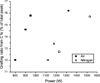 |
Fig. 7 Evolution of the grafting ratio of C1s peak according to device power in air and nitrogen plasmas. |
3.5 Morphological modifications
In order to correlate impact of chemical and morphological modifications on surface wettability, AFM images in Peak Force mode are studied at micrometer scale. Figure 8 shows topographies of industrial PEEK surfaces prior to and after activation by the UL-SCAN device.
It can be noted that untreated surface shows a relatively smoother surface than the treated ones, despite the existence of scratches. They could be explained by the industrial fabrication process and cutting steps. After a plasma treatment in air, the morphology of the surface does not change a lot compared to the untreated one, even at high power. Other images (not shown here) obtained at various powers show the same profile, which indicates that air plasma does not strongly influence surface morphology. Nanoroughness measurements from AFM profiles confirm the visual observations with Ra values around 4 ± 0.5 nm.
Under nitrogen plasma, Figure 8 shows a remarkable change in surface morphology. A lot of prominences appear after activation at relatively low device power. This typical profile is visible whatever the device power. Plasma etching seems to be more evident under nitrogen plasma and it designs surface through the restructuring of the polymer macromolecules [33]. This phenomenon directly affects the nanoroughness which increases from 4.3 ± 0.6 nm (Fig. 8c) to 6.2 ± 1.2 nm (Fig. 8d). Nanoscope software also provides information about the enhancement of the specific surface through the Sw parameter. Under nitrogen plasma, it increases up to 3% of the ideal and plane analyzed surface, compared to untreated one. These roughness modifications may assume an increase in the strength of a future interface with a coating through a greater contribution of mechanical anchoring as described in the literature [34]. The chemical etching at high device power seen in Figure 8d is presumably due to reaction between active species like radicals or metastables, blowing by the high velocity gas stream and PEEK polymer macromolecules.
Wettability measurements of Figure 6 under nitrogen plasma show no evolution of surface free energy according to the power. Such results differ from the latter interpretation about the specific surface Sw and the presence of prominences. Indeed, morphological modifications induced by plasma treatments or other surface treatments have shown to affect water wetting characteristics of surfaces [35]. Either hydrophilic or hydrophobic surface properties can be obtained, explaining by the Wenzel or the Cassie-Baxter models at a micro or nanometer scale [36,37]. Busscher et al. [38] studied the influence of random surface roughness of several polymers on wettability through equilibrium, advancing and receding contact angles. According its conclusions, the surface roughening does not affect contact angles until a threshold of Ra which is 0.1 μm. Moreover, based on the Wenzel theory, he found that the roughness accentuates the hydrophobic or the hydrophilic properties of a surface. An exception exists for surfaces shown an intermediary contact angle, typically 60° < θ < 86°, where it is no more influenced by the variation of the roughness. In the case of industrial PEEK substrates used in this study, Ra parameter is modified from the nanometer scale as discussed above, so it could be assumed that it is too small to significantly affect the surface wettability.
This morphological study associated to the chemical analysis of the top layer indicate an evolution of the surface profile with the device power. Chemical modifications as oxidation is similar under both gas plasma to increase surface wettability whereas chemical active species involved in nitrogen discharge induce a surface-roughening at nanoscale. In the next paragraph, the discharge under both gas plasma, and more precisely the arc behavior, will be studied by means of an equivalent electrical circuit. It is a simplified way to understand how the arc behaves depending on the device power applied.
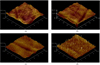 |
Fig. 8 AFM images (5 μm x 5 μm) of an (a) untreated PEEK, (b) air plasma treated at 1320 W, and nitrogen plasma treated at (c) 1180 W and (d) 1530 W. |
3.6 Study of the equivalent electrical circuit
The electrical study of the discharge in paragraph 3.2 described quasi sinusoidal waveforms of the current and the voltage as illustrated in Figure 2. From an electrical point of view, the UL-SCAN device can therefore be modeled by a linear circuit composed of a resistor in parallel with a capacitor. This approach is also described in [39]. The resistor represents the arc between the electrodes and the capacitor represents the equivalent capacitor due to the high voltage cable shield connected to the ground. Figure 9 represents the equivalent electrical circuit from the power supply output to the arc discharge. The association of the capacitor and the inductor leads to a resonant electrical circuit which explains the behavior of the power when varying the frequency.
This model allows to have a macroscopic view of the discharge and a better understanding of the discharge behavior when the power varies. The values of R and C, corresponding to the resistor and the capacitor, are determined using a fitting algorithm on the measurements of the voltage U(t) and the current I(t). This is done for air and nitrogen plasma, for the whole range of power and gas flow. Whatever the conditions, the capacitance stays constant always almost the same (around 5 pF), which is coherent with the high voltage shielded cable used. Knowing the value of the capacitor C, it is possible to calculate the current IR(t) which represents the discharge current, see (3).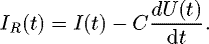 (3)
(3)
Figure 10 shows time evolution of current IR(t) associated to the voltage U(t) flowing through the resistor for two different values of the device power under air plasma. In Figure 10a corresponding to a device power equal to 890 W, there is no phase shift between the discharge current IR(t) and the voltage U(t). Both have exactly the same shape, which means that the discharge can be modeled by a simple resistor with a constant value over time. However, when the device power increases from 890 W to 1070 W (Fig. 10b), the discharge current and the voltage have no longer the same shape. They are not sinusoidal anymore and instabilities appear randomly in some period. Moreover, current and voltage maximum values are not constant among period. The electrical behavior of the discharge cannot be modeled anymore using a constant resistor. The variation of the resistor during the period can be related to an arc length fluctuation or an electrical conductivity variation. Similar evolutions of current and voltage are also visible in nitrogen discharge at high power.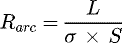 (4)
(4)
with L and S respectively the length and the section of the arc; σ the conductance of the arc.
By collecting all the values of equivalent resistor calculated from U(t) and IR(t) according to device power, further understanding about the causes of these fluctuations previously highlighted can be achieved. Figure 11 represents the variation of the mean arc resistance as a function of the device power under air and nitrogen plasmas for different values of the gas flow. As it can be seen, if the discharge power increases, the resistance decreases up to a value around 600 Ω. This trend is consistent with the literature if one consider a constant section of the arc S on both electrodes during the discharge [40]. The increasing of the device power increases ionization of the gas and as a consequence, the conductance σ of the medium. Following (4), if the conductance increases, resistance of the arc decreases since it is inversely proportional. Figure 11 shows a reverse exponential evolution of Rarc over the whole range of device power in air and nitrogen discharges. By increasing the gas flow rate, Rarc is shifted in X axis to the upper values of device power and in Y axis to the upper resistance of the arc.
The increase of the mean arc resistance positively correlated to the gas flow rate can be arise from two physical phenomena. The first deals with an increasingly cooling of discharge medium by cold species flowing between the electrodes. The result is a decrease of the ionization as the conductance. The second potential phenomenon has a consequence on the arc dimensions during discharge [40]. With increasing the gas flow rate, the arc length becomes more elongated due to dynamic forces which pushes the grounded electrode spot to the torch exit. According to (4), the increase of the arc length results in an increase of arc resistance.
 |
Fig. 9 Electrical equivalent circuit of the arc plasma torch. IC represents the current in the capacitor and IR the current in the resistor. I and U represent the current and the voltage of the main circuit. |
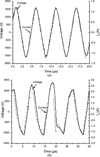 |
Fig. 10 Time evolution of IR(t) (–) and voltage U(t) (—) in the case of (a) low power 890 W and (b) high power 1070 W discharge. |
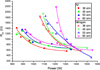 |
Fig. 11 Increase of the mean arc resistance with increasing gas flow rate due to cooling of the gas and extension of the arc length. |
4 Conclusion
The discharge characteristics of the UL-SCAN plasma device from AcXys technology® working in air or nitrogen are investigated on industrial PEEK CFRP by varying the gas flow rate and the power Pa consumed by the electrical supply. Both post-discharges of the arc plasma torch can improve hydrophilic properties but phenomena occurring are different in the two plasma gases, as shown by wettability behavior and confirmed by chemical analysis.
Performance of activation can be tuned by changing parameters and gas plasma to favor either mechanical anchorage and/or chemical adhesion. These results contribute to a greater definition of parameters process in industrial environment by understanding and quantifying phenomena which cause the improvement of wettability and hence paint adherence.
From electrical measurements, two discharge behaviors have been distinguished depending on the device power. At low values (typically less than 1000W), discharge can be modelled as a linear resistance. At higher values, the simple electrical model used is no longer appropriate and current and voltage are not in phase anymore. Some physical explanations are given to describe arc behavior instability between electrodes at high power.
Author contribution statement
You will find below the authors contributions statement for our article: Lucie BRES: Experimental work and trials, original writing of the document, discussions, reviewing, correction; Nicolas NAUDE: Experimental trials and modelling on electrical part, technical supervision, discussions, reviewing, correction; Nicolas GHERARDI: Technical supervision, discussions, reviewing, correction; Bertrand RIVES: Technical supervision from an industrial point of view, discussions, reviewing, correction.
Acknowledgments
The authors want to thank Tescan Analytics for their assistance in surface modifications studies.
References
- C. Soutis, Mater. Sci. Eng. A 412, 171 (2005) [Google Scholar]
- M. Sharma, S. Gao, E. Mäder 2015 et al., Compos. Sci. Technol. 102, 35 (2015) [Google Scholar]
- D.N. Markatos, K.I. Tserpes, E. Rau et al., Composites Part B 45, 556 (2013) [Google Scholar]
- A.A. Collyer, High-temperature engineering thermoplastics, in A Practical Guide to the Selection of High-Temperature Engineering Thermoplastics, Elsevier, Oxford, England (1990) [Google Scholar]
- B.R.K. Blackman, A.J. Kinloch, J.F. Watts, Composites 25, 332 (1994) [Google Scholar]
- A. Ganesan, M. Yamada, M. Fukumoto, J. Therm. Spray Technol. 23, 236 (2013) [Google Scholar]
- P.B. Comyn, L. Mascia, G. Xiao, Int. J. Adhes. Adhes. 16, 97 (1996) [Google Scholar]
- C.K. Akkan, M. Hammadeh, S. Brück et al., Mater. Lett. 109, 261 (2013) [Google Scholar]
- C. Tendero, C. Tixier, P. Tristant et al., Spectrochim. Acta Part B 61, 2 (2006) [Google Scholar]
- U. Kogelschatz, Plasma Phys. Controlled Fusion 46, B63 (2004) [Google Scholar]
- A. Fridman, A. Chirokov, A. Gutsol, J. Phys. D.: Appl. Phys. 38, R1 (2004) [Google Scholar]
- F. Massines, G. Gouda, N. Gherardi et al., Plasmas Polym. 6, 35 (2001) [CrossRef] [Google Scholar]
- U. Kogelschatz, Plasma Chem. Plasma Process. 23, 1 (2003) [CrossRef] [Google Scholar]
- S. Guimond, M.R. Wertheimer, J. Appl. Polym. Sci. 94, 1291 (2004) [CrossRef] [Google Scholar]
- N. Gherardi, G. Gouda, E. Gat et al., Plasma Sources Sci. Technol. 9, 340 (2000) [Google Scholar]
- C. Jama, O. Dessaux, P. Goudemand et al., Surf. Interface Anal. 18, 751 (1992) [Google Scholar]
- E. Temmerman, Y. Akishev, N. Trushkin et al., J. Phys. D.: Appl. Phys. 38, 505 (2005) [Google Scholar]
- S.-W. Ha, R. Hauert, K.-H. Ernst et al., Surf. Coat. Technol. 96, 293 (1997) [Google Scholar]
- J.F. Coulon, N. Tournerie, H. Maillard, Appl. Surf. Sci. 283, 843 (2013) [Google Scholar]
- A. Dupuis, T.H. Ho, A. Fahs et al., Appl. Surf. Sci. 357, 1196 (2015) [Google Scholar]
- K.G. Kostov, T.M.C. Nishime, A.H.R. Castro et al., Appl. Surf. Sci. 314, 367 (2014) [Google Scholar]
- AcXys Technologies, 2016. [Online]. Available: http://www.acxys.com/fr/ [Google Scholar]
- J.-C. Joud, M.-G. Barthés-Labrousse, Physico-chimie des surfaces et acido-basicité, ISTE Edition, London, England (2015) [Google Scholar]
- D.K. Owens, R.C. Wendt, J. Appl. Polym. Sci. 13, 1741 (1969) [Google Scholar]
- Y.P. Raizer, Gas Discharge Physics, Springer, Berlin (1991) [Google Scholar]
- W. Zhu, J.L. Lopez, Plasma Sources Sci. Technol. 21, 034018 (2012) [CrossRef] [Google Scholar]
- K. Hassouni, F. Massines, J.-M. Pouvesle, Plasma hors-équilibre à des pressions atmosphériques, in Plasmas froids, génération, caractérisation et technologies (Publications de l'Université de Saint-Etienne, 2004) [Google Scholar]
- M.-J. Shenton, M.-C. Lovell-Hoare, G.-C. Stevens, J. Phys. D.: Appl. Phys. 34, 2754 (2001) [Google Scholar]
- S. Jha, S. Bhowmik, N. Bhatnagar et al., J. Appl. Polym. Sci. 118, 173 (2010) [Google Scholar]
- C. Sarra-bournet, Fonctionnalisation de surface de polymères par plasma à la pression atmosphérique. Animation de surface et dépôt de couches minces par un procédé de décharge par barrière diélectrique, Ph.D. dissertation, Univ. of Toulouse, France (2009) [Google Scholar]
- A. Van Deynse, P. Cools, C. Leys et al., Appl. Surf. Sci. 328, 269 (2015) [Google Scholar]
- W. Pan, W. Zhang, W. Zhang et al., Plasma Chem. Plasma Process. 21, 23 (2001) [Google Scholar]
- A. Lafabrier, Etude de l'adhérence de revêtements poudre appliqués sur substrats composites à matrice polymère, Ph.D. dissertation, Univ. of Toulon, France (2014) [Google Scholar]
- H. Krump, I. Hudec, M. Jaššo et al., Appl. Surf. Sci. 252, 4264 (2005) [Google Scholar]
- S.J. Hitchcock, N.T. Carroll, M.G. Nicholas, J. Mater. Sci. 16, 714 (1981) [Google Scholar]
- E. Yoon, S. Ho, H. Kong et al., Tribol. Lett. 15, 145 (2003) [Google Scholar]
- H. Nakae, R. Inui, Y. Hirata et al., Acta Mater. 46, 2313 (1998) [Google Scholar]
- H.J. Busscher, A.W.J. van Pelt, P. de Boer et al., Colloids Surf. 9, 319 (1984) [Google Scholar]
- A. Belinger, N. Naudé, J.P. Cambronne et al., J. Phys. D.: Appl. Phys. 47, 345202 (2014) [Google Scholar]
- G. Ni, Q. Lin, L. Lei et al., J. Phys. 46, 455 (2013) [Google Scholar]
Cite this article as: Lucie Brès, Nicolas Gherardi, Nicolas Naudé, Bertrand Rives, Experimental investigations of a remote atmospheric pressure plasma by electrical diagnostics and related effects on polymer composite surfaces, Eur. Phys. J. Appl. Phys. 95, 30801 (2021)
All Tables
Atomic percentages of oxygen, carbon and nitrogen determined by XPS analysis prior to and after activation.
All Figures
|
Fig. 1 Schematic of the experimental device UL-SCAN and process parameters. |
| In the text | |
|
Fig. 2 Typical current (–) and voltage (—) time evolution of the UL-SCAN power supply under air plasma at 200 kHz and 30 slm. |
| In the text | |
|
Fig. 3 Abacus of the calculated power transferred to the discharge (Pd) and the power consumed by the electrical supply (Pa) under air and nitrogen plasmas, according to frequency and gas flow rate. |
| In the text | |
|
Fig. 4 (a) Photographs of an air (right) and nitrogen (left) post-discharge at 1235 ± 15 W and 60 slm gas flow rate. (b) Evolution of the post-discharge length in both gas plasmas. |
| In the text | |
|
Fig. 5 Evolution of temperature experienced by the substrate during activation. |
| In the text | |
|
Fig. 6 Surface free energy evolution calculated by OWRK method according to device power under air and nitrogen plasmas. Q represents the gas flow rate. |
| In the text | |
|
Fig. 7 Evolution of the grafting ratio of C1s peak according to device power in air and nitrogen plasmas. |
| In the text | |
|
Fig. 8 AFM images (5 μm x 5 μm) of an (a) untreated PEEK, (b) air plasma treated at 1320 W, and nitrogen plasma treated at (c) 1180 W and (d) 1530 W. |
| In the text | |
|
Fig. 9 Electrical equivalent circuit of the arc plasma torch. IC represents the current in the capacitor and IR the current in the resistor. I and U represent the current and the voltage of the main circuit. |
| In the text | |
|
Fig. 10 Time evolution of IR(t) (–) and voltage U(t) (—) in the case of (a) low power 890 W and (b) high power 1070 W discharge. |
| In the text | |
|
Fig. 11 Increase of the mean arc resistance with increasing gas flow rate due to cooling of the gas and extension of the arc length. |
| In the text | |
Current usage metrics show cumulative count of Article Views (full-text article views including HTML views, PDF and ePub downloads, according to the available data) and Abstracts Views on Vision4Press platform.
Data correspond to usage on the plateform after 2015. The current usage metrics is available 48-96 hours after online publication and is updated daily on week days.
Initial download of the metrics may take a while.