| Issue |
Eur. Phys. J. Appl. Phys.
Volume 89, Number 2, February 2020
Electrical Engineering Symposium (SGE 2018)
|
|
|---|---|---|
| Article Number | 20902 | |
| Number of page(s) | 9 | |
| Section | Physics of Energy Transfer, Conversion and Storage | |
| DOI | https://doi.org/10.1051/epjap/2020180287 | |
| Published online | 23 April 2020 | |
https://doi.org/10.1051/epjap/2020180287
Regular Article
Bond graph multi-physics modeling of encapsulating materials in power electronic modules★
Laboratoire Génie de Production, LGP, Université de Toulouse, INP-ENIT,
Tarbes, France
* e-mail: This email address is being protected from spambots. You need JavaScript enabled to view it.
Received:
29
September
2018
Received in final form:
19
February
2020
Accepted:
20
February
2020
Published online: 23 April 2020
Abstract
This paper focuses on multi-physics modeling of encapsulating gels in power electronic modules for transient and steady-state simulation. With the emergence of wide-bandgap semiconductors such as SiC or GaN, operating at a higher temperature than conventional Si power chips, this passive element of the packaging appears as a few studied element sensitive to thermal and mechanical stresses. A thermo-mechanical coupled modeling of the material, based on bond graph representation, is presented. This approach allows to establish, under the same formalism, an analogy between the different physical domains. From this analogy, a multi-physical nonlinear state space representation is built, allowing transient simulation of the thermo-mechanical behavior of the material. This way of modeling and simulating is particularly adapted for a preliminary study during the upstream phases of design of the power electronic modules. It quickly establishes the maximum temperature and mechanical strains experienced by the gel.
Contribution to the Topical Issue “Electrical Engineering Symposium (SGE 2018)”, edited by Adel Razek.
© B. Trajin and P.-E. Vidal, EDP Sciences, 2020
 This is an Open Access article distributed under the terms of the Creative Commons Attribution License (http://creativecommons.org/licenses/by/4.0), which permits unrestricted use, distribution, and reproduction in any medium, provided the original work is properly cited.
1 Introduction
Wide-bandgap semiconductor materials (SiC, GaN,...) are able to operate at higher temperature ranges than traditional silicon chips. Thus, their use allows to increase power densities within the power modules with more integrated structures and functions [1–5]. However, their introduction in power electronic leads to an increase in thermo-mechanical stresses on the various components of the modules packaging (solder, substrate, encapsulant...). In this packaging, the encapsulating silicone gel constitutes a particularly sensitive component [6–8] to thermal, mechanical and dielectric stresses. It is subjected to specific failure modes [9] during the ageing of the power modules. Indeed, thermal ageing, may lead to a decrease in the hydrophobic properties of the gel. The introduction of resulting moisture can cause oxidation phenomena, a decrease in dielectric insulation properties and thus accelerate the ageing of the material itself or cause a major failure of the power module [10]. Preliminary studies of the encapsulating gel have led to establish thermal and mechanical models [11,12] in order to obtain the permanent thermal and mechanical fields within the encapsulating material, mainly using finite elements software.
The modeling methodology proposed in this paper, based on the bond graph representation, leads to establish a nonlinear multi-physics state space representation of the system in order to simulate thermo-mechanical behavior of the gel with a satisfactory accuracy. This modeling allows to get rid of finite element models, which are too complex and cumbersome to process during the upstream phases of design. Section 2 presents the system under concern and the associated bond graphs. Section 3 leads to obtain the nonlinear state space system for simulation. Finally, in section the Section 4, experimental results on the studied system are compared with the simulation results obtained with the proposed methodology.
2 Thermo-mechanical modeling
The proposed modeling method is based on the analogy of physical domains in terms of power transfers formalized by the bond graph [13–15]. The bond graph also represents integral causality of the phenomena, leading to establish all the differential equations of the first order of the physical system. These equations constitute the state space representation used for numerical simulations using numerical integration methods. The proposed approach is here used to model the thermo-mechanical behavior of an encapsulating silicone gel used in power electronic modules.
2.1 Bond graph modeling
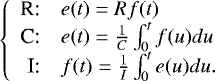
The bond graph representation illustrates power transfers in systems using directional links. Each link carries two variables necessary for the expression of the power P(t): a generalized effort e(t) and a generalized flow f(t) (P(t) = e(t)f(t)). The variables of effort and flow are connected by means of resistance R, compliance C or inertance I (1). Note that the elements R, C and I can be nonlinear.
 (1)
(1)
Equations (1) also transcript the concept of integral causality. Thus, in an element C (resp. I), the generalized effort (resp. the generalized flow) is a temporal consequence of the generalized flow (resp. of the generalized effort). In addition to the previous elements, effort sources Se and flow sources Sf as well as iso-effort 0, iso-flow 1, transformer TF and gyrator GY junctions are added [16].
Power transfers being common to the different physical domains, it is possible to express the analogy existing between these domains, some of which are summarized in Table 1. Note that there is no inertance element in the thermal domain.
Analogy between physical domains
2.2 Studied system
In order to simplify the problem and highlight the modeling approach, this study deals with the case of a one-dimensional bar of silicone gel. Thermal phenomena occurring along different directions of the main dimension of the bar will be neglected. Thus, the bar will be considered thermally insulated outside of its main dimension. In the same way, the mechanical movements of the bar outside its main dimension will be considered as negligible.
Thus, the considered system consists of a cylinder of length L0 = 16 × 10−2 m at ambient temperature of 295 K and of circular section of diameter d = 1.10−2 m. To establish the model, the system is sampled into n = 16 elementary volumes of length Δx = 1 × 10⁻² m (Fig. 1).
The thermal boundary conditions are therefore defined on the two orthogonal bases to the main lengthof the bar. One of the bases is in convection with air at ambient temperature Ta. The thermal boundary condition on the opposite base is defined as a heating temperature Th. This temperaturecorresponds to the operating temperature of a semiconductor component in a power module. It is chosen so as to be lower than the maximum limit temperature of use of the silicone gel. The gel is therefore submitted to temperature included between its glass transition temperature and its destruction temperature.
Mechanically, one of the bases (the heated one) is blocked and is submitted to a zero-displacement boundary condition. The second base is free allowing dilation without stress under thermal excitation of the material. This configuration is close to the implementation of the gel in a power electronic module providing an expansion free volume for the gel.
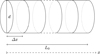 |
Fig. 1 Studied system. |
2.3 Thermal model
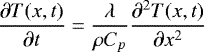
Within the framework of the proposed thermal model, radiative transfer phenomena are neglected. Only conductive and convective transfers are studied. These transfers are governed by the heat equation expressed in a single spatial dimension, without sources of internal heat by (2) [17,18].
 (2)
(2)
with:
-
T(x, t) the local temperature depending on time t,
-
λ the thermal conductivity of the material,
-
ρ the density of the material,
-
Cp the specific heat capacity of the material.
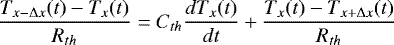
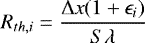
Considering the local temperature, it is possible to spatially discretize heat equation with the finite centered difference method of order 2 [19,20]. In this case, for a given x position, in the case of a conductive transfer, the discretized heat equation with a step Δx can be written as (3).
 (3)
(3)
with :
-
 the thermal conduction resistance,
 -
 the conduction surface,
 -
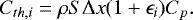
Cth = ρV Cp the thermal capacity of the material,
-
V = SΔx the volume of the sample.
It is demonstrated that in case of convective transfer, a similar expression of the convection thermal resistance can be obtained  with h the convection coefficient [21].
The definition of generalized energy variables and bond graph elements in the thermal domain (see Tab. 1) as well as the equation (3), lead to the thermal bond graph of a elementary volume of material (see Fig. 2). The element C has for value the thermal capacity Cth of the elementary volume. The generalized effort imposed by this element represents the temperature Ti, assumed to be uniform in the sampled elementary volume noted i. The R elements consider the thermal conduction resistances Rth between twoelementary neighboring volumes.
By cumulating elementary volumes and with the addition of the boundary conditions, the complete thermal bond graph of the system is then obtained. It has to be reminded that in the studied system, the thermal boundary conditions consist in temperature sources (heating temperature imposed on a base and ambient temperatureon the opposite one). These temperature sources are therefore represented by effort sources Se. The full bond graph is given in Figure 3. For simplicity, only three elementary volumes are represented. The element R between the last elementary volume and the ambient temperature source considers both the thermal conduction of the material and the convection resistance with the ambient air.
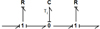 |
Fig. 2 1D thermal bond graph of an elementary volume. |
 |
Fig. 3 1D thermal bond graph of the studied system. |
2.4 Mechanical model
The proposed mechanical model developed for a silicone gel is based on macroscopic rheological models using equivalent spring and dampers assemblies. Several models can be used such as the Burger, the Kelvin-Voigt, the Maxwell or the generalized Maxwell models [22]. In the case of encapsulating silicone gels of power electronic modules, the mechanical and thermo-mechanical stresses are generally of sufficiently low amplitude to ensure that the material keeps linear and reversible properties at a given temperature. In this study, the Kelvin-Voigt rheological model given in Figure 4 is chosen. It allows to represent the reversible visco-elastic behavior of silicone gels. The elasticity is modeled by a spring of stiffness equal to the elastic modulus E (i.e. compliance equal to  ) of the material according to the Hooke law (4) [23] with ɛ the strain of the material and σc the stress. In the one-dimensional case, the strain is defined as the ratio between the variation length Δl and the initial length l0 (5). Note that in the studied system, initial length l0 of an elementary volume equals to the step Δx in (3). In bond graph, the elasticity is represented by a C element of value
  linking the generalized effort (stress) to the integral of the generalized flux (strain rate
  ), meaning the generalized displacement. The viscosity is modeled by a damper of parameter η, using element R in bond graph.
 (4)
(4)
 (5)
(5)
In the Kelvin-Voigt rheological model, spring and damper share the same strain rate and are therefore connected by a 1 junction.
In the case of the studied system, the mechanical excitation is related to the coefficient of thermal expansion α which links the temperature variation of the material to its strain (6) where T0 represents a reference temperature. Indeed, l0 is defined as the length of the material at temperature T0.
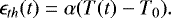 (6)
(6)
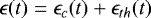
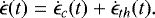
In the formalism of the mechanical bond graph, the strain is equivalent to the generalized displacement, i.e. to the integral of the generalized flow. However, in bond graph, there is no source of generalized displacement. Thus, the spring-damping mechanical cell is excited by a generalized flow source, corresponding to a strain rate  sharing the same effort as the cell [12], through a iso-effort 0 junction. Indeed, it is clear that the total strain of a mechanical cell is the sum of the strain related to the applied stress and the strain related to the thermal expansion (7). The relation between the strain rates is directly deduced (8).
 (7)
(7)
 (8)
(8)
Moreover, the source of strain rate modeling the thermal expansion (9) is obtained by derivation of (6) where α is considered as a constant parameter.
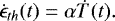 (9)
(9)
For an elementary volume noted i, the mechanical bond graph is represented in Figure 5. The generalized effort imposed by the C element represents the local stress on the σc,i spring.
By cumulating elementary volumes and adding boundary conditions, the complete mechanical bond graph of the system is obtained. It has to be reminded that in the studied system, one of the bases of the cylinder is free and displacement occurs without stresses. This lack of stress results in an effort source Se of value σt (t) = 0, ∀t. The full bond graph is given in Figure 6. For simplicity, only three elementary volumes are represented. The different elementary volumes are contiguous and therefore share the same effort. It can be seen in the Figure 6 that the four 0 junctions could be regrouped into one. However, these 0 junctions allow to clearly differentiate the three elementary volumes, without impacting the model.
Note that strain rate on the 1 junctions are govern by first order differential equations with σt (t) = 0. Moreover, at initial time instant, the system is motionless and ɛc,i(t = 0) = 0. Then, ɛc,i(t) = 0, ∀t and ɛi (t) = −ɛth,i
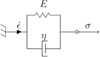 |
Fig. 4 Kelvin-Voigt rheological model. |
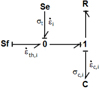 |
Fig. 5 1D mechanical bond graph of an elementary volume. |
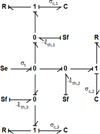 |
Fig. 6 1D mechanical bond graph of the studied system. |
2.5 Thermo-mechanical model
The thermo-mechanical bond graph of the complete system (Fig. 7) is easily obtained from the bond graphs of Figures 3 and 6. The thermo-mechanical link is made through the knowledge of the efforts imposed by the thermal capacities of the elementary volumes and their derivatives that modulate the sources of mechanical flux. Here again, only three elementary volumes are represented for reasons of clarity.
The thermo-mechanical coupling expressed by the bond graph in Figure 7 is clearly incomplete. Indeed, the only expressed link is from thermal part to the mechanical one. However, it is obvious that other thermo-mechanical links exist. On the one hand, thermal parameters such as thermal resistance and capacitor depend on geometric sizes. On the other hand, mechanical parameters such as elastic modulus and viscosity depend on temperature [24–26].
These two thermo-mechanical links can easily be integrated in the model. Indeed, as stated before, the definition of bond graph elements R and C does not suppose a linear equation between effort and flow. This means that thermo-mechanical link included in parameters variation is hidden but exists in the bond graph. Some authors propose to introduce modulated resistance and compliance [27]. This specific formalism could be applied in our study to visually describe thermo-mechanical links that are considered in this paper but is not necessary.
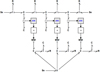 |
Fig. 7 1D thermo-mechanical bond graph of the studied system. |
3 State space equations
Using the bond graph, the state space equations of the system are determined systematically. In order to establish these equations, it is necessary to identify the state variables which are simply the generalized effort of the elements C and the generalized flow of the elements I. The first step is therefore to identify these variables and then their derivatives which are linked to the dual variables of the state ones. The equations at the junctions as well as those of the passive elements allow to express the derivative of the state variables as a function, at least, of the other state variables and, if necessary, of the inputs of the system.
3.1 Equations of variable parameters
In order to consider the whole electro-mechanical coupling phenomena, thermal parameters of elementary volumes (Rth,i and Cth,i) have to take into account variations of geometry (i.e. the length) of the volume due to thermal expansion. According to the basic definition of parameters in Section 2.3, parameters equations becomes (10) and (11).
 (10)
(10)
 (11)
(11)
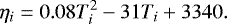
Moreover, according to rheological tests at different temperature, elastic modulus and viscosity of the material under test vary with the temperature. These tests allow to identify nonlinear variation laws for these parameters. Note that these laws are valuable for a range of temperature between the glass transition temperature of the gel and its maximum temperature of use. The corresponding identified laws for an elementary volume are given in (12) and (13).
 (12)
(12)
 (13)
(13)
3.2 Thermal equations
The thermal equations are deduced from the thermal bond graph in Figure 3. It has to be assumed that the temperature of an elementary volume is calculated at the center of the volume. Considering equations of parameters in Section 3.1, for the volumes noted i, we get the system of equations (14). It is then necessary to differentiate boundaries internal volumes of the system.
![Mathematical equation: \begin{equation*} \left\{ \begin{aligned} \dot{T_1}(t)=&\frac{2}{C_{th,1}}\left[ -\left(\frac{2}{R_{th,1}}+\frac{1}{R_{th,2}}\right) T_1(t) \right.\\ &+ \left(\frac{1}{R_{th,1}}+\frac{1}{R_{th,2}}\right) T_2(t)\\ &+ \left.\frac{1}{R_{th,1}}T_h(t)\right]\\ \dot{T_i}(t)=&\frac{2}{C_{th,i}}\left[ \left(\frac{1}{R_{th,i}}+\frac{1}{R_{th,i-1}} \right)T_{i-1}(t)\right.\\ &+\left(\frac{1}{R_{th,i}}+\frac{1}{R_{th,i+1}} \right) T_{i+1}(t)\\ & \left.-\left(\frac{2}{R_{th,i}}+\frac{1}{R_{th,i-1}}+\frac{1}{R_{th,i+1}}\right) T_{i}(t)\right]\\ & \textrm{for} \,i\in \llbracket 2~;~ n-1 \rrbracket\\ \dot{T_n}(t)=&\frac{2}{C_{th,n}} \left[\left(\frac{1}{R_{th,n}}+\frac{1}{R_{th,n-1}}\right) T_{n-1}(t) \right.\\ &-\left( \frac{1}{R_{th,n}+R_{th,n-1}}+\frac{1}{R_{th,n}+2R_{cv}} \right) T_n(t) \\ & \left.+ \frac{1}{R_{th,n}+2R_{cv}}T_a(t)\right].\\ \end{aligned} \right.\end{equation*}](/articles/epjap/full_html/2020/02/ap180287/ap180287-eq21.png) (14)
(14)
The system of equations (14) can then easily be written in a matrix form (15) where T (t) is the state vector of the local temperatures. Note that the thermal dynamic matrix Ath of size n × n is a sparse matrix. It is the same for the matrix Bth of size n × 2 which contains only two non-null terms.
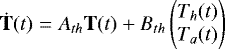 (15)
(15)
3.3 Mechanical equations
The mechanical equations of the system are also obtained directly from the bond graph in Figure 6. It is assumed that mechanical properties are constant, at a given temperature, in an elementary volume. Based on the identification of the mechanical state variables, it is possible to directly obtain the state space equations in a matrix form (16) where σc (t) is the state vector of the mechanical stresses and 1n,1 is the unit vector of size n × 1.
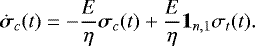 (16)
(16)
It has to be reminded that in the case of the studied system, whose movements are free along the main direction, the boundary condition of stress σt(t) is null whatever t. Moreover, without thermal excitation, the system is considered to stay in the initial state and the local stresses σc,i (t= 0) are also null whatever t. Thus, it is shown that the free thermal expansion is carried out at no stress throughout time.
Moreover, it can be noticed that mechanical state equation (16) resulting from the identification of the state variables is incomplete. Indeed, the sources of strain rate do not appear in these equations. Thus, this state equation cannot completely describe the whole mechanical behavior. Thermo-mechanical phenomena must therefore be considered in order to obtain mechanical equations for simulating the whole dynamic behavior of the system.
3.4 Thermo-mechanical equations
Using the bond graph in Figure 6, it is demonstrated that the strain rate of the elementary volumes  can be written as a function of the strain rate sources
  and the derivative of local stresses (16). These equations then take the form of a state space matrix (17) where ɛ(t) is the state vector of strain and
  the vector of strain rates of thermal origin.
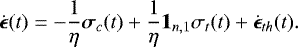 (17)
(17)
Using (9) and (15), (17) is developed and strain rates are expressed only using state variables (18).
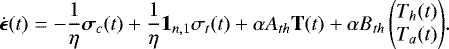 (18)
(18)
Finally, equations (15), (16) and (18) allow to obtain the thermo-mechanical state space equations of the studied system (19) where In is the identity matrix of size n × n.
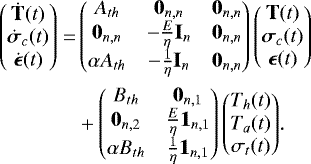 (19)
(19)
Once the strains have been obtained, the displacement qi of elementary volume noted i can be expressed (20).
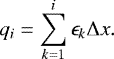 (20)
(20)
4 Experimental results
4.1 Experimental setup
The proposed experimental setup allows to measure the thermal and mechanical behavior of an encapsulating gel bar dedicated to power electronic modules submitted to thermal stress. The material is a silicone gel (Silgel 616), cast and crosslinked in a glass tube of internal diameter of 1 × 10⁻² m over a length of 16 × 10−2 m. Using a glass tube ensures that the mechanical strength of the material while minimizing the friction between the gel and the tube. The tube is then placed vertically on a temperature-controlled heating plate. Thermocouples are inserted into the silicone gel at different positions to measure the local temperature. Two thermocouples measure the boundary conditions: the temperature of the heating plate Th and the ambient temperatureTa. Figure 8 depicts the experimental setup. Finally, a thermal insulator composed of extruded polystyrene is positioned around the tube. It has a thermal conductivity approximately ten times lower than the silicone gel, which maximizes the heat flux in the axis of revolution of the tube and thus maximize the mono-dimensional nature of thermal phenomena.
As shown in Figure 9, a digital camera is positioned to film the free base of the silicone gel and thus to measure the global displacement due to the thermal excitation.
Constant thermo-mechanical properties of the material have been experimentally measured or deduced from its datasheet:
Thermal properties:
-
conductivity: λ = 0, 1 W.(m.K)−1,
-
heat capacity: Cp = 80 W.K−1.kg−1,
-
density: ρ = 970 kg.m−3,
-
convection coefficient: h = 70 W.m−2.
Mechanical properties:
-
thermal expansion: α = 5.10−4.
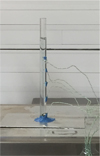 |
Fig. 8 Experimental setup. |
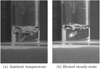 |
Fig. 9 Free base view of the silicone gel. |
4.2 Thermal behavior
In order to compare the experimental and simulated data, the measured temperatures of the heating plate and the ambient air are considered as inputs of the thermo-mechanical model. Temperatures are simulated at the same positions as those by thermocouples. Figure 10 allows to compare the results of measurement and simulation. The indicated distances are measured between the heated base of the gel and the thermocouple.
It can be seen in Figure 10, that simulated temperatures and measured ones have similar values in steady state. It is supposed that most of the discrepancies may be due to inaccurate positioning of the thermocouples in the gel. It can also be noted that the simulated thermal curves have different response times from those that are measured. This could come from several phenomena not considered in the simulation. On the one hand, the thermal parameters of the materials are considered constant whatever the temperature. However, the thermal conductivity and the specific heat capacity are parameters that can depend on the temperature [28–31]. On the other hand, it is assumed that the convection coefficient is constant whatever the temperature. However, due to fluid mechanic effects, thermal exchange coefficient between the gel and ambient air depends on temperatures of the gel and the air. Finally, even if the silicone gel bar is thermally insulated outside its main dimension, this insulation may not be perfect and some heat flux may exist along the radius of the bar.
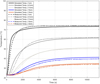 |
Fig. 10 Thermal behavior of the system. |
4.3 Mechanical behavior
The free base of the silicone gel is filmed all along the test and all the images of the film are post-processed by an image analysis software. This allows to extract the displacement of the free base of the gel along time. The total displacement is simulated and compared in Figure 11 to the measured one.
Once again, there is a relatively good accuracy between the thermo-mechanical simulation and the experimental measurement. The observed discrepancies can be interpreted in several ways. First of all, the differences on the mechanical quantities may come from the differences on the thermal quantities. Indeed, the displacement is directly related to the elementary strains (20) which themselves are only linked (in the configuration of the test) to the thermal field (19). Any inaccuracy on the thermal model is therefore reflected on the mechanical response. Inaddition, it is assumed in the model that the gel does not adhere the glass tube in which it is cast. This hypothesis may induce a higher increase rate for the simulated mechanical response than the measured one. Indeed, adhesion acts as a brake on thermal expansion and thus slows down the evolution of strains and then displacement along time. Finally, it is assumed in the model that all effects are mono-dimensional. Obviously, thermal expansion occurs in all directions, along the length of the silicone gel bar but also along its radius. A strain occurring according tothe radius of the cylinder will result, through the Poisson’s ratio, by a strain along the length of the cylinder. Thus, in steady state, the global displacement found experimentally should be larger than the simulated one.
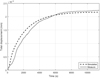 |
Fig. 11 Total displacement of the silicone gel bar submitted to heating. |
4.4 Thermodynamic conservation of energy
Finally, in order to verify the proposed model, it is possible to check the thermodynamic principle about conservation of energy. The first law of thermodynamics links the infinitesimal variations of internal energy dU to heat flow δQ and work δW exchange with its environment (21).
 (21)
(21)
Firstly, an input heat flow Qin comes from the heating plate to the system and an output heat flow Qout pulls out to the environment. Secondly, it can be noticed that there is no work exchange between the system the environment. Indeed, it is assumed that the material is free to expand due to thermal phenomena. Moreover, δW = pdV where p is the pressure of external efforts. In the model, external stress σt(t) = 0, then we get p = 0 and finally δW = 0. Thirdly, internal energy is evaluated using bond graph through energy of C and I elements. Equation (21) can be rewritten as (22).
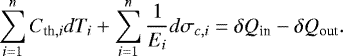 (22)
(22)
Figure 12 shows internal energy dU evaluated along time using model and δQin − δQout evaluated along time using measurements on experimental system and model. As it can be seen, internal energy equals variation of heat flux during the experiment, validating the proposed model. Moreover, it can be noticed than steady state is reach during the experiment as the infinitesimal variation of internal energy tends to 0.
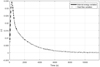 |
Fig. 12 Energy variation in the system. |
5 Conclusions and further work
In this paper, a thermo-mechanical modeling approach was presented for the simulation of a few studied material used in power electronic modules: the silicone gel used for encapsulation. The proposed approach is based on bond graph representation which easily leads to the potentially nonlinear state space equations of the considered system and thus to simulate it, with the usual numerical integration tools, under transient and steady-state. The proposed model provides dynamic simulation results with a low computational cost and thus allows a preliminary and rapid evaluation of the design of the encapsulant used in the power electronic modules. Although the results may be considered as less accurate than finite element simulations, they are obtained much more rapidly, because finite element models are usually hard to calculate. Moreover, finite element softwares do not make dynamic systems solving, they only solve succession of steady-states, which complicates the analysis if the temporal discretization is not adequately chosen. The proposed model is therefore much better suited than finite element simulations in the upstream phases of power electronic modules design when many simulations are needed.
The work presented still needs to be developed for three-dimensional simulations. The extension of the thermal model 1D to 3D does not induce any specific problems, except on the size of the obtained matrices. However, the development of the 3D mechanical model is more difficult because of the couplings existing between the different dimensions of the space. In addition, some phenomena are not considered in the present study, such as the variation of thermal properties with the temperature as well as the phenomena of adhesion. These points will be developed in future works.
Author contribution statement
All the authors were involved in the preparation of the manuscript. All the authors have read and approved the final manuscript.
References
- J. Meng, X. Wen, Y. Zhong, Z. Qiu, A thermal model for electrothermal simulation of power modules, in International Conference on Electrical Machines and Systems (ICEMS), 2013 [Google Scholar]
- N. Vivies, M. Haussener, H. Welemane, B. Trajin, P.-E. Vidal, Characterization of an integrated buck converter using infrared thermography, in 12th conference on Quantitative InfraRed Thermography (QIRT), 2014 [Google Scholar]
- B. Trajin, P.-E. Vidal, J. Viven, Electro-thermal model of an integrated buck converter, in 17th European Conference on Power Electronics and Applications (EPE), 2015 [Google Scholar]
- R. Kunzi, Thermal Design of Power Electronic Circuits, CAS-CERN Accelerator School: Power Converters (CERN, Geneva, 2014) [Google Scholar]
- C.H. van der Broeck, M. Conrad, R.W. De Doncker, Microelectron. Reliab. 55, 1938 (2015) [Google Scholar]
- M. Ciappa, Microelectron. Reliab. 42, 653 (2002) [Google Scholar]
- V.R. Manikam, E.N. Tolentino, F.N. Ramuhzan, N.M. Tajuddin, A. Aripin, Improving reliability for electronic power modules, in 36th International Electronics Manufacturing Technology Conference (IEMT), 2014 [Google Scholar]
- L. Xu, M. Wang, Y. Zhou, Z. Qian, S. Liu, Effect of Silicone Gel on the Reliability of Heavy Aluminum Wire Bond for Power Module During Thermal Cycling Test, in 66th Electronic Components and Technology Conference (ECTC), 2016 [Google Scholar]
- H. Ye, M. Lin, C. Basaran, Finite Elem. Anal. Des. 38, 601 (2002) [Google Scholar]
- T. Ebke, A. Khaddour, D. Peier, Degradation of silicone gel by partial discharges due to different defects, in Eighth International Conference on Dielectric Materials, Measurements and Applications, 2000, pp. 202–207 [CrossRef] [Google Scholar]
- S. Wen, G.-Q. Lu, Finite-element modeling of thermal and thermomechanical behavior for three-dimensional packaging of power electronics modules, in 7th Intersociety Conference on Thermal and Thermomechanical Phenomena in Electronic Systems (ITHERM), 2000 [Google Scholar]
- M. Haussener, S. Cailhol, B. Trajin, P.E. Vidal, F. Carrillo, Microelectron. Reliab. 55, 2045 (2015) [Google Scholar]
- D.C. Karnopp, D.L. Margolis, R.C. Rosenberg, System dynamics: a unified approach (John Wiley & Sons, New Jersey, 1990) [Google Scholar]
- J. Thoma, Bond graphs: introduction and applications (Elsevier Science, Amsterdam, 1975) [Google Scholar]
- P.J. Gawthrop, L.P.S. Smith, Metamodelling: bond graphs and dynamic systems, (Prentice Hall, New Jersey, 1996) [Google Scholar]
- D.C. Karnopp, D.L. Margolis, R.C. Rosenberg, System dynamics : modeling and simulation of mechatronic systems, 4th edn. (John Wiley & Sons, New Jersey, 2006) [Google Scholar]
- J.B.J. Fourier, Théorie analytique de la chaleur (Firmin Didot, pere et fils, 1822) [Google Scholar]
- J.R. Cannon, The One-Dimensional Heat Equation, Encyclopedia of Mathematics and Its Applications (Cambridge University Press, Cambrisge, 1984) [CrossRef] [Google Scholar]
- J.C. Butcher, Numerical methods for ordinary differential equations, 3rd edn. (John Wiley & Sons, New Jersey, 2016) [CrossRef] [Google Scholar]
- J.D. Lambert, Numerical Methods for Ordinary Differential Systems, (John Wiley & Sons, New Jersey, 1991) [Google Scholar]
- F.P. Incropera, Fundamentals of heat and mass transfer, 7th edn. (John Wiley & Sons, New Jersey, 2012) [Google Scholar]
- A. Malkin, A. Isayev, Rheology: Concepts, Methods, and Applications (ChemTec Publishing, Ontario, 2006) [Google Scholar]
- M.A. Meyers, K.K. Chawla, Mechanical behavior of materials (Cambridge University Press, Cambridge, 2009) [Google Scholar]
- P.G. Wright, Phys. Edu. 12, 323 (1977) [CrossRef] [Google Scholar]
- C.J. Seeton, Tribol. Lett. 22, 67 (2006) [Google Scholar]
- Y.C. Wang, V. Kodur, Cem. Concr. Compos. 27, 864 (2005) [Google Scholar]
- W. Borutzky, Bond Graph Methodology (Springer, Berlin, 2010) [CrossRef] [Google Scholar]
- T. Bhowmicka, B.R. Gupta, S. Pattanayaka, Cryogenics 32, 623 (1992) [Google Scholar]
- T. Bhowmicka, B.R. Gupta, S. Pattanayaka, Cryogenics 32, 616 (1992) [Google Scholar]
- T. Bhowmicka, S. Pattanayaka, Cryogenics 30, 11 (1990) [Google Scholar]
- S. Kashi, R. Varley, M. De Souza, S. Al-Assafi, A. Di Pietro, C. de Lavigne, B. Fox, Polym. Plast. Technol. Eng. 57, 1687 (2018) [Google Scholar]
Cite this article as: Baptiste Trajin, Paul-Etienne Vidal, Bond graph multi-physics modeling of encapsulating materials in power electronic modules, Eur. Phys. J. Appl. Phys. 89, 20902 (2020)
All Tables
All Figures
|
Fig. 1 Studied system. |
| In the text | |
|
Fig. 2 1D thermal bond graph of an elementary volume. |
| In the text | |
|
Fig. 3 1D thermal bond graph of the studied system. |
| In the text | |
|
Fig. 4 Kelvin-Voigt rheological model. |
| In the text | |
|
Fig. 5 1D mechanical bond graph of an elementary volume. |
| In the text | |
|
Fig. 6 1D mechanical bond graph of the studied system. |
| In the text | |
|
Fig. 7 1D thermo-mechanical bond graph of the studied system. |
| In the text | |
|
Fig. 8 Experimental setup. |
| In the text | |
|
Fig. 9 Free base view of the silicone gel. |
| In the text | |
|
Fig. 10 Thermal behavior of the system. |
| In the text | |
|
Fig. 11 Total displacement of the silicone gel bar submitted to heating. |
| In the text | |
|
Fig. 12 Energy variation in the system. |
| In the text | |
Current usage metrics show cumulative count of Article Views (full-text article views including HTML views, PDF and ePub downloads, according to the available data) and Abstracts Views on Vision4Press platform.
Data correspond to usage on the plateform after 2015. The current usage metrics is available 48-96 hours after online publication and is updated daily on week days.
Initial download of the metrics may take a while.