| Issue |
Eur. Phys. J. Appl. Phys.
Volume 100, 2025
|
|
|---|---|---|
| Article Number | 32 | |
| Number of page(s) | 10 | |
| DOI | https://doi.org/10.1051/epjap/2025030 | |
| Published online | 23 December 2025 | |
https://doi.org/10.1051/epjap/2025030
Original Article
Integrated resonant structure for colloidal dispersion stability: development of a resonant optical zetameter
1
Univ Rennes, CNRS, IETR - UMR 6164, F-35000 Rennes, France
2
Univ Rennes, CNRS, ISCR - UMR 6226, F-35000 Rennes, France
3
Univ Rennes, CNRS, IPR - UMR 6251, F-35000 Rennes, France
4
Univ Rennes, UAR 2025 ScanMAT, F-35000 Rennes, France
5
Centrale/Supelec, Campus de Rennes, F-35510 Cesson-Sévigné, France
* e-mail: This email address is being protected from spambots. You need JavaScript enabled to view it.
** e-mail: This email address is being protected from spambots. You need JavaScript enabled to view it.
Received:
22
May
2025
Accepted:
18
November
2025
Published online: 23 December 2025
Abstract
Long-term storage of colloidal solutions presents significant challenges in maintaining the physical and mechanical properties of manufactured products over extended periods. Ensuring stability is critical for agro-alimentary products, pharmaceutical formulations, and petroleum applications to preserve product quality and longevity during storage. Monitoring the stability of colloidal dispersions is essential for anticipating potential degradation over time. This study explores the evaluation of stability criteria using quasi-surface resonant analysis. Specifically, the zeta potential of colloidal solutions is investigated via resonant optical parameter, the Free Spectral Range (FSR), to distinguish between stable and unstable dispersions. For this purpose, sensors based on organic UV210 Micro-Resonators (MRs) were fabricated using deep UV photolithography. These MRs were integrated into an optical test platform, enabling real-time data collection with a spectrometer and dedicated MATLAB processing. The study focuses on black carbon nano powders dispersed in water and in water plus an anionic surfactant (Sodium Dodecyl Sulfate, SDS). The findings show that unstable solutions exhibit an increasing FSR over time, which is indicative of sedimentation, whereas stable dispersions maintain a constant FSR. These results are validated through complementary rheological and zeta potential measurements, establishing a clear correlation between FSR variations and colloidal dispersion stability. This study demonstrates the potential of resonant optical measurements as a novel tool for assessing colloidal dispersion stability, functioning as a “zetameter” on a surfacic platform.
Key words: Colloidal dispersion / dark solution stability / integrated photonics and resonators / zeta potential
© J. Gastebois et al., Published by EDP Sciences, 2025
 This is an Open Access article distributed under the terms of the Creative Commons Attribution License (https://creativecommons.org/licenses/by/4.0), which permits unrestricted use, distribution, and reproduction in any medium, provided the original work is properly cited.
1 Introduction
The development of industrial products involves multiple stages before commercialization. In order to meet market demands, various formulations of a product are developed and compared [1]. These pre-products may also be designed to replace an initial product by modifying a component to enhance product properties (physical, mechanical, or chemical), to reduce production costs, to simplify manufacturing processes, or to replace a component with a renewable alternative [2–4]. Therefore, it is essential to assess the effectiveness and overall quality of these pre-products before scaling up to mass production.
Colloids are systems with one phase, composed of particles or droplets with characteristic dimensions typically between 1 nm and 1 μm, dispersed in another continuous phase. Depending on the nature of the dispersed and continuous phases, various types of colloids can be identified, such as aerosols (solid or liquid in gas), emulsions (liquid in liquid), and sols or suspensions (solid in liquid) [5]. Colloidal dispersions, specifically, refer to systems where solid particles are suspended within a liquid medium.
These systems exhibit distinct physicochemical behaviors due to the large surface-to-volume ratio of the dispersed phase. As long as particle agglomeration is prevented, electrostatic interactions and Brownian motion dominate over gravitational forces, thereby counteracting sedimentation [6]. Colloidal dispersions play a crucial role in numerous industrial applications, including agri-food products, cosmetics, pharmaceuticals, coatings, and paints [7–12]. The functionality and longevity of these materials depend on their stability, the ability of dispersed particles to remain uniformly distributed without agglomeration and sedimentation. Colloidal stability arises from the balance between attractive van der Waals forces and repulsive electrostatic interactions that prevent particle agglomeration, while gravitational stability depends on the particle size and density. Any perturbation in these equilibria can lead to phase separation and degradation of product performance. Assessing and monitoring these stability mechanisms is thus crucial for ensuring product reliability and predicting long-term behavior.
Several techniques have been developed to assess the stability of colloidal dispersions. Dynamic Light Scattering (DLS) measures the time-dependent fluctuations of scattered light from particles in suspension, providing information on particle size distribution and aggregation kinetics. Turbidimetry monitors changes in the optical density of the solution over time, which reflects sedimentation or flocculation processes. Rheological measurements assess the flow behavior and viscosity of the suspension, revealing changes associated with particle interactions, flocculation, or gel formation [13–15]. Each of these methods provides complementary insight into different aspects of stability, ranging from microscopic particle dynamics to bulk solution behavior. Among these approaches, zeta potential measurement remains a key parameter to assess the stability of colloidal dispersions by quantifying the electrostatic potential at the particle-liquid interface. It provides insight into the balance of attractive and repulsive forces that govern particle interactions within the dispersion [16–18]. Conventional techniques presented here deals with volumetric investigations and then struggle to investigate opaque and dark substances. Indeed, commercial devices use the light intensity variation as a measurement tool to study sedimentation and migration process and therefore cannot study opaque and dark substances due to inherent strong absorption [19,20].
The purpose of this paper is to develop an integrated resonant structure capable of investigate colloidal dispersion stability through resonant signal and then approach the notion of optical resonant zetameter. Optical cavity micro resonators (MRs) can be integrated into photonic chips to function as lab-on-chip sensing devices within optical platforms [21–23]. The interaction between the confined optical mode and the surrounding environment through an evanescent field enable the detection of biochemical species and the analysis of soft matter behavior [24–27]. The sensing platform consists of a series of racetrack MRs fabricated from UV210 organic polymer resin, patterned onto an oxidized silicon wafer using deep UV (DUV) photolithography [28]. Resonances within the MRs are excited by a super luminescent diode, and the resulting signal provides real-time environmental data throughout the dynamic process. Changes in the soft matter system under investigation are analyzed by continuously tracking FSR variations using a spectrometer and a dedicate Matlab code. The quasi-surface resonant principle used by the designed resonant structure enable to investigate over hundreds of micrometers [29]. To this end, the dispersion of black carbon nano powders in aqueous media is investigated to study dark substances. Black carbon is composed of spherical particles that are formed through the incomplete combustion of heavy hydrocarbons [30]. These primary particles, approximately 10 nanometers in size, are irreversibly aggregated into larger clusters, typically spanning hundreds of nanometers. The behavior of black carbon in aqueous environments is analyzed to ensure stability in liquid electrolytes and to prevent sedimentation after charge and discharge cycles [31,32]. Therefore, an investigation is conducted on the stability of black carbon nano powders dispersions in aqueous solutions with varying black carbon concentrations and with the addition of an anionic surfactant to modify the electrostatic forces balance. Two black carbon nano powders, differentiated by their primary particle size, are dispersed either in water or in water with SDS solutions. These samples are then subjected to resonant analysis, with the results regarding dispersion stability corroborated through zeta potential measurements and rheological analysis. A clear correlation between the FSR variation slope and dispersion stability is thoroughly detailed.
In the second part, the fabrication process of the resonant elements is described in detail. The experimental protocol follows, describing the preparation of black carbon solutions and their integration into the optical experimental setup. The fourth section discusses the physical principles behind the resonances and detailed the use of zeta potential measurements as an indicator of colloidal dispersion stability. The final section presents the analysis of the resonant signals and extends the results to the development of an optical resonant zeta-meter.
2 Fabrication and characterization of the resonant structure
The optical cavities are composed of racetrack micro-resonators (MRs) coupled to a tapered access waveguide, with a fixed gap of 400 nm between the taper and the MRs. The key design parameters of the resonator are a curvature radius R = 5 μm, a coupling length Lc = 5 μm, and a waveguide width w = 3 μm. The fixed waveguide height (0.8 μm) favors propagation of the fundamental optical modes (TE00 or TM00), while the waveguide width permits the existence of the first next higher-order modes (TE01 or TM01). The racetrack geometry enhances interaction with the access waveguide, maximizing coupling through an increased Lc, while the tapered input of the waveguide facilitates efficient light injection during experimental tests. Therefore, the mode distributed within the racetrack MR provides a vast detection area of 90 μm2, which is further enhanced by the presence of four MRs to enable spatially averaged measurements. Additionally, this configuration results in deeper resonant peaks, improving visibility during signal processing.
The waveguide core is fabricated using a UV210 polymer positive resin deposited onto a thermal silica layer. This silica layer, with a thickness of 1.6 µm, is grown on a 3-inch silicon wafer through wet oxidation. The silica cladding ensures minimal radiation loss during mode propagation and provides strong adhesion for the waveguide. The resonant elements are shaped through deep UV lithography at 248 nm, which offers higher precision compared to conventional 365 nm lithography. The UV210 polymer is spin-coated onto the oxidized silicon wafer, achieving a typical height of 900 nm. These fabrication processes allow for the creation of resonant structures with micrometer-scale precision in a cleanroom environment. A summary of the fabrication process, along with a Scanning Electron Microscope (SEM) image of the resonant structure highlighting the geometrical parameters, is presented in Figure 1.
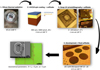 |
Fig. 1 Fabrication process of the resonant structure, along with an SEM image of an MR coupled to an access waveguide, with the geometrical parameters highlighted. |
3 Resonant signal and colloidal dispersion stability
3.1 Physical principles of resonances
The designed resonant structure is capable of detecting dynamic particle migration when the colloidal dispersion is in direct contact. Indeed, this detection is enabled by the optical mode circulating within the MR, which acts as a probe of the surrounding environment [33,34]. The solutions to Maxwell's equations indicate the presence of an oscillating component within the waveguide core and an evanescent component in the cladding. Resonance occurs when the round-trip phase condition equals 2mπ (where m is an integer), resulting in resonant wavelengths given by  . Here, neff is the effective refractive index of the propagating mode, P the resonator's geometric parameter, and m denotes the mode number. When the target substance is in direct contact with the resonant element, the structure forms a three-layer configuration in terms of guided optics. Variations in the upper cladding environment, such as migration, sedimentation, or densification, modify neff, providing insights into the behavior of soft matter. The organic core is sandwiched between the silica substrate and the upper cladding which is the colloidal dispersion in this study. The spectral difference between two successive resonant wavelengths, known as the Free Spectral Range (FSR), is defined by:
  where λ0 is the excited wavelength, and
  the group refractive index of the structure incorporating modal dispersion. Monitoring the dynamic evolution of the FSR provides information on the time-dependent variations of
  . Assuming the refractive indices of both the core and the substrate remain constant, the FSR evolution directly reflects changes in the refractive index of the upper cladding. In this study, these variations correspond to the dynamic migration of particles within colloidal dispersions.
3.2 Zeta potential as an indicator of colloidal dispersion stability two
Zeta potential measurements provide valuable insights into the behavior of nanomaterials within biological systems and are therefore commonly used to characterize colloidal dispersion stability. The zeta potential is defined as the electrostatic potential at the slipping plane of a particle suspended in a liquid medium, representing the potential difference between the dispersion medium and the stationary layer of fluid attached to the particle surface. It reflects the interaction between the particle and its surrounding medium, rather than being a direct measure of the particle's surface charge. This potential arises due to the formation of an electrical double layer when particles are dispersed in a polar medium, such as water. The double layer consists of an inner region, known as the Stern layer, where ions are strongly bound to the particle surface, and a diffuse region where ions are less associated. The magnitude and sign of the zeta potential determine the balance of attractive and repulsive forces among particles, directly influencing the stability of the colloidal dispersion.
The zeta potential is determined experimentally from the electrophoretic mobility of particles under an applied electric field and can be calculated using the equation:  where
where  represents the measured electrophoretic mobility, ζ is the zeta potential, ε is the solvent dielectric permittivity, η is the viscosity, and F (κa) is Henry's function. The choice of approximation for F (κa)depends on the relative thickness of the electrical double layer. The Hückel approximation (F (κa) = 1) assumes a thick double layer, where the particle radius is small compared to the Debye length, while the Smoluchowski approximation (F (κa) = 1.5) assumes a thin double layer, which is typically valid for nanoparticles dispersed in aqueous media [35].
A high absolute zeta potential value, typically exceeding ±30 mV, indicates strong electrostatic repulsion between particles, preventing aggregation and promoting dispersion stability [36]. Conversely, zeta potential values below this threshold suggest weak repulsive forces, leading to particle agglomeration, flocculation, and eventual sedimentation, resulting in an unstable dispersion. Factors such as pH, ionic strength, and temperature influence zeta potential measurements and must therefore be carefully controlled to ensure accurate and reproducible results.
4 Experimental protocol
4.1 Black carbon colloidal sample preparation
The stability of the colloidal dispersion is investigated through an analysis of black carbon solutions. Black carbon nano powder consists of primary spherical particles ranging from 20 to 100 nanometers in diameter. These primary particles are held together by covalent forces, forming aggregates between 100 and 500 nanometers. These aggregates can further assemble into agglomerates as large as 100 μm due to attractive Van der Waals forces; however, they can be broken apart depending on the surrounding environment or through the application of ultrasonic treatment.
Two black carbon nano powders are considered in this study. The first, referred to as “Powder 1” is sourced from Nanografi Nanotechnology (n°NG04EO7010), while the second, referred to as “Powder 2”, is obtained from Sigma-Aldrich (n°699632). Both samples have been characterized using SEM analysis. The nano powder was deposited onto a carbon tape surface, followed by a metal deposition process to enhance imaging contrast. As shown in Figure 2, “Powder 1” exhibits primary particles with an average size of 50 nm, while “Powder 2” has an average primary particle size of 80 nm. Additionally, the formation of aggregates several hundred nanometers in size is observed in both powders. The results for “Powder 2” are further corroborated through Nano Tracking Analysis (Fig. 3). In the analysis, the black curve represents the average measurement across three independent experiments, while the red area indicates the maximum values obtained from these analyses. The particle sizes corresponding to each peak are highlighted in blue. It is observed that the majority of aggregates remain below 500 nm with an average particle size of 85 nm which is in good agreement with the SEM image.
For the resonant analysis, a black carbon solution is added to a solvent solution. As both volumes are fixed, three different black carbon solutions are prepared to obtain three distinct final dispersions. The volume, concentration parameters, and sample designations are summarized in Table 1. Black carbon nano powders are dispersed in either deionized water or deionized water containing a surfactant, Sodium Dodecyl Sulfate (SDS). The latter is prepared at a concentration of 4 mmol, which remains below the critical micellar concentration of SDS (7–8 mmol at 20°C). The samples are then sonicated for 5 min to break up agglomerates and achieve the most homogeneous dispersion possible.
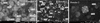 |
Fig. 2 SEM images of black carbon nano powders 1 and 2, with primary particle size and aggregate size highlighted. “Powder 1” exhibits an average primary particle size of 50 nm, whereas “Powder 2” has an average primary particle size of 80 nm. |
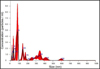 |
Fig. 3 Nano Tracking Analysis (NTA) of black carbon “Powder 2” The average particle size (85 nm) is in good agreement with the SEM analysis. |
Summary of black carbon solution preparation with the associated designation.
4.2 Integration of the photonic chip into the optical set up
The investigation of solution stability is conducted by integrating the designed photonic chip into an optical test platform, schematically represented in Figure 4. Resonances are excited using a broadband laser diode (SUPERLUM), centered at 795 nm with a spectral width of 40 nm, allowing the excitation of multiple resonances. The platform, comprising the resonant structure and the colloidal solution, was mounted on a Peltier module to maintain a constant temperature of 20°C throughout the experiments. Data acquisition is performed using the HR4000 spectrometer from Ocean Optics. A MATLAB script is employed to collect data and execute real-time Fast Fourier Transform (FFT) analysis to extract the Free Spectral Range (FSR) through a Lagrange interpolation that provides a single, well-defined peak [37]. This platform enables the dynamic monitoring of soft matter processes, specifically the stability of colloidal dispersions in this study.
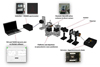 |
Fig. 4 Optical test platform, from the broadband laser diode source (SUPERLUM) to the spectral analysis system (HR4000 spectrometer), which is connected to a computer and controlled through a real-time MATLAB interface. |
5 Results and discussion
5.1 Resonant signal analysis for stability tracking
The study will compare the behavior of solutions differentiated by the type of black carbon nano powder (resulting in two different primary particle sizes), concentration (C1, C2, and C3, as shown in Tab. 1), and host environment (water or water plus a surfactant). To this end, a tank placed above the MRs is filled with 150 µL of water, and 5 µL of black carbon solution is added to achieve the final concentrations presented in Table 1. The FSR is continuously monitored over several hours, and its variation provides information on the migration process. The temperature is monitoring through Peletier module and is maintained at 20°C.
Initial observations of migration and colloidal dispersion behavior can be made regardless of the black carbon powder size. For the first set of measurements, the normalized FSR variation for “Powder 1” is depicted in Figure 5 for concentrations C1 and C3. A globally constant FSR value is observed for concentration C1, even after 180 min. For concentration C3, a relative increase in the FSR is noted after 120 min, with a factor of 1.05. The primary particle size and aggregate size of “Powder 1” are small compared to the excitation wavelength, with an average primary particle size of approximately 50 nm, which corresponds to λ/15. For the lowest concentration, the particles are too sub-wavelength: the evanescent mode tail interacts with an effective index (as described by effective medium theory in material science) and is not able to detect particle migration. It is therefore expected that the FSR remains constant. As the black carbon concentration increases, FSR variation becomes detectable. For concentration C3, the mean free path decreases, leading to the formation of agglomerates up to several hundred micrometers in size. These agglomerates are large enough to be detected, but their sedimentation begins after 100 min.
In contrast, for “Powder 2” the particle size is sufficient to detect migration (as indicated by FSR variation) at any black carbon concentration (Figs. 6 and 7). An increase in FSR is detected, corresponding to sedimentation, as previously demonstrated. The normalized FSR slope variation enables the characterization of the sedimentation process. The end of the sedimentation process is marked by the stabilization of the FSR, which reaches its maximum value. The relative amplitude of the FSR variation, which strongly depends on the intrinsic material properties, remains consistent across all black carbon concentrations (typically 1.15 times higher than the initial FSR value), suggesting that the black carbon properties (permittivity) remain unchanged in all measurements. Viscosity measurements were performed using an Anton Paar MCR 702e rheometer. Results show that the C3 dispersion exhibits higher viscosity than the C2 dispersion (Fig. 8). This increase in viscosity at higher concentrations is attributed to enhanced particle-particle interactions, which increase the collision probability and hinder solvent mobility. Additionally, as the mean free path decreases, nanoparticles experience stronger inter-particle forces, leading to agglomerate formation that further increases viscosity. As a consequence, an increased FSR slope is expected as the black carbon concentration increases. This trend is visible between concentrations C1 and C2 and it is noteworthy that the C3 curve shows a maximum FSR reached at 100 min, followed by a rearrangement phase. The sedimentation process is more pronounced at higher black carbon concentrations. This can be quantified by comparing the FSR difference, extracted via Fast Fourier Transform (FFT) analysis, between the beginning of the experiment and after 150 min for each concentration (Fig. 7). This FSR variation reflects changes in the local optical index (the permittivity) above the resonator, arising from particle redistribution during sedimentation. The results show that the FSR shift is more significant at higher concentrations, indicating stronger optical density changes near the resonator surface. Specifically, the evanescent field of the guided mode senses a higher optical density for concentration C3 (FSR = 0.82nm) compared to concentration C1 (FSR = 0.64nm). The FSR slope is therefore a reliable indicator of the sedimentation rate, as demonstrated in previous studies [37,38]. In this work, this observation is successfully extended to dark substances, with the FSR slope shown to be closely correlated with the stability of colloidal dispersions.
An additional observation concerns the FSR oscillations observed at concentration C1, which disappear at concentration C2 for “Powder 2” (Fig. 6). When the black carbon solution is introduced into the water filled tank, a concentration gradient naturally forms due to differences in local particle density. This gradient generates surface tension variations across the liquid–air interface via the Marangoni effect [39,40]. The resulting interfacial tension differences drive convective flows, producing vortices that transport black carbon particles across the photonic chip surface. These particle motions locally alter the refractive index near the waveguide, giving rise to the observed FSR oscillations. As the black carbon concentration increases, the interparticle distance decreases and particle mobility becomes more constrained. The mean free path of individual particles is reduced, which limits the extent of convective redistribution. At higher concentrations, particle agglomeration increases the effective particle radius, while the suspension viscosity rises too (Fig. 8), both of which further restrict particle mobility. Consequently, the Stokes drag force, proportional to ηrv (where η is the fluid viscosity, r the particle radius, and v the particle velocity), becomes substantially larger, obstructing particle motion and the associated convective flows. As a result, the amplitude of Marangoni driven FSR oscillations decreases and can disappear. This behavior indicates the presence of a concentration threshold, beyond which surface tension-driven flows are insufficient to overcome particle crowding and the enhanced drag of larger agglomerates. Above this threshold, dense packing and strong interparticle interactions effectively suppress Marangoni convection, preventing the appearance of oscillatory signals.
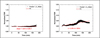 |
Fig. 5 Plot of the normalized FSR evolution over time for two different concentrations of black carbon “Powder 1”: C1 and C2. |
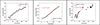 |
Fig. 6 Plot of the normalized FSR evolution over time for three different concentrations of black carbon “Powder 2”: C1, C2 and C3. The sedimentation is highlighted by the FSR increase and the associated slope which increase with the black carbon concentration. |
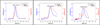 |
Fig. 7 FFT analysis of two spectra at different time points was performed to extract the FSR and illustrate its evolution across the three concentrations C1 (left), C2 (centre) and C3 (right). |
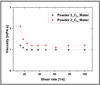 |
Fig. 8 Plot of the viscosity as a function of the shear rate for the black carbon “Powder 2” at 2 concentrations C2 and C3. An increase in the concentration increases the viscosity. |
5.2 Correlating resonant analysis with zeta potential measurement
Sedimentation has been shown to be more pronounced as the particles form agglomerates. To prevent this issue, black carbon nano powders are now dispersed in water with the addition of a surfactant, Sodium Dodecyl Sulfate (SDS). The total black carbon concentration in the solution placed above the chip remains the same, and the FSR evolution is recorded as done previously. As a result, the FSR no longer exhibits variation over time (Fig. 9). The slope variation is negligible when compared to the aqueous solutions without surfactant. The lack of FSR evolution over time indicates that the dispersion is effectively stabilized by the addition of SDS. The surfactant prevents the formation of agglomerates by reducing inter-particle forces, thereby improving the colloidal stability and preventing sedimentation.
To corroborate the observations from the photonic experiments, zeta potential measurements are performed on the black carbon dispersions. Two samples at concentrations C2 and C3, diluted 100 times to reduce absorption, with and without SDS, are studied. Thirty statistical measurements are conducted for each sample. The electrophoretic mobility is measured under an applied electric field of 20.27 V/cm. The Dirac form obtained from the data substantiates the measurements (Fig. 10). The Smoluchowski model, which is applicable to polar media, is used to extract the zeta potential, and the results are presented in Figure 11.
It is noteworthy that the zeta potential for both concentrations doubles in the presence of SDS. The addition of the anionic surfactant alters the charge of the black carbon particles. The SDS anions are absorbed by the black carbon particles, resulting in a more negative zeta potential compared to the samples without SDS. With the presence of SDS, the dispersion exceeds the absolute threshold of ±30 mV, which is known in the literature as the stability threshold for colloidal dispersions.
This confirms that the photonic chip is effective in detecting the stability of dark colloidal dispersions. The FSR slope can serve as an indicator of relative stability, with its value correlating to the order of magnitude of the zeta potential. The quasi-surface resonant analysis highlights its potential to differentiate between stable and unstable products.
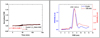 |
Fig. 9 Plot of the normalized FSR evolution over time of black carbon dispersed into water plus SDS. The ad of the surfactant stabilizes the FSR highlighted by the FFT at 2 different time. |
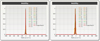 |
Fig. 10 Electrophoretic mobility for samples at concentration C3 with (on the right) and without SDS (on the left). |
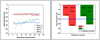 |
Fig. 11 Statistical measurement of the zeta potential (on the left). Histogram representation with the stability threshold overcome by the solution with SDS. |
6 Conclusion
In this study, the stability of dark colloidal dispersions was successfully investigated using an integrated photonic chip with micro-resonators made from an organic material. The behavior of black carbon nano powders dispersed in an aqueous medium was analyzed through quasi-surface resonant analysis. By measuring the Free Spectral Range (FSR) variations, it was shown that the FSR slope serves as a reliable indicator of the dispersion's stability. The results indicate that higher black carbon concentrations lead to increased instability, explained by the formation of agglomerates and enhanced sedimentation, as evidenced by a measurable FSR slope. In contrast, when Sodium Dodecyl Sulfate (SDS) was added, the FSR remained stable over time, with no slope observed, highlighting the stabilization of the dispersion. Zeta potential measurements corroborated the FSR variations, revealing a significant increase in stability with SDS, as reflected by the zeta potential exceeding the colloidal stability threshold. This optronic device proved capable of distinguishing between stable and unstable products, providing a novel approach for the real-time monitoring of colloidal dispersion stability.
Acknowledgments
The authors would like to thank the “Fondation d'Entreprise Grand Ouest” plus the “Fondation Rennes” for the financial support. This publication is also supported by the European Union through European Regional Development Fund (ERDF), Ministry of Higher Education and Research, CNRS, Brittany region, Conseils Départementaux d'Ille-et-Vilaine and Côtes d'Armor, Rennes Métropole, and Lannion Trégor Communauté, through the CPER Project CyMoCod. The authors also thank the NanoRennes platform for the DUV process (https://www.ietr.fr/en/nr-nanorennes-platform).
Funding
This research received no external funding.
Conflicts of interest
The authors declare that they have no known competing financial interests or personal relationships that could have appeared to influence the work reported in this paper.
Data availability statement
This article has no associated data generated and/or analyzed.
Author contribution statement
J. Gastebois: Writing − Original Draft Preparation, Writing − Review & Editing, Investigation. A. Szymczyk: Investigation. G. Paboeuf: Investigation. F. Scholkopf: Investigation. V. Vié: Investigation. A. Saint-Jalmes: Investigation. H. Lhermite: Investigation. H. Cormerais: Writing − Review & Editing. F. Gauffre: Investigation. B. Bêche: Writing − Review & Editing, Validation, Supervision, Project Administration, Conceptualization.
References
- A. Durand, Actual. Chim. 407, 24 (2016) [Google Scholar]
- J.A. Tickner, J.N. Schifano, A. Blake, C. Rudisill, M.J. Mulvihill, Environ. Sci. Technol. 49, 742 (2015) [Google Scholar]
- R. Raghunathan, P. Nelluri, D. Rajendran, R. Pandiselvam, V. Thulasiraman, S.K. Sahoo, S. Pillai, R.E. Jerome, A. Kothakota, Int. J. Environ. Sci. Technol. 22, 6181 (2025) [Google Scholar]
- A.K. Mohanty, S. Vivekanandhan, J.-M. Pin, M. Misra, Science 362, 536 (2018) [CrossRef] [PubMed] [Google Scholar]
- D.H. Everett, in Basic Principles of Colloid Science (Royal Society of Chemistry, 2007) [Google Scholar]
- T. Cosgrove, in Colloid Science: Principles, Methods and Applications (John Wiley & Sons, 2010) [Google Scholar]
- E. ten Grotenhuis, R. Tuinier, C.G. de Kruif, J. Dairy Sci. 86, 764 (2003) [Google Scholar]
- H.K. Hyvärinen, J.-M. Pihlava, J.A. Hiidenhovi, V. Hietaniemi, H.J.T. Korhonen, E.-L. Ryhänen, J. Agric. Food Chem. 54, 48 (2006) [Google Scholar]
- J.L. Zatz, Ind. Eng. Chem. Prod. Res. Dev. 23, 12 (1984) [Google Scholar]
- B. Bellich, M. Franzin, D. Curci, M. Cirino, A. Maestro, G. Bennati, G. Stocco, G. Adami, N. Maximova, D.L. Grasso, E. Barbi, D. Zanon, Pharmaceutics 16, 1018 (2024) [Google Scholar]
- U.D. Folco, D.D. Falco, F. Marcucci, G. Nobili, V. Moretti, G. Gioventù, C. Tubili, J. Nutr. Ther. 1, 152 (2012) [Google Scholar]
- J. Jacob, S. Grelier, M. Grau, B. Chorein, Coatings 12, 1722 (2022) [Google Scholar]
- Z. Jia, J. Li, L. Gao, D. Yang, A. Kanaev, Colloids Interfaces 7, 15 (2023) [Google Scholar]
- O.S. Alade, M. Mahmoud, D.A. Al Shehri, A.S. Sultan, ACS Omega 6, 5910 (2021) [Google Scholar]
- F. Khalkhal, A.S. Negi, J. Harrison, C.D. Stokes, D.L. Morgan, C.O. Osuji, Langmuir 34, 1092 (2018) [Google Scholar]
- I. Ostolska, M. Wiśniewska, Colloid Polym. Sci. 292, 2453 (2014) [Google Scholar]
- Y. Ramaye, M. Dabrio, G. Roebben, V. Kestens, Materials 14, 290 (2021) [Google Scholar]
- S. Kamble, S. Agrawal, S. Cherumukkil, V. Sharma, R.V. Jasra, P. Munshi, ChemistrySelect 7, e202103084 (2022) [Google Scholar]
- Formulaction, TURBISCAN TOWER Analyseur de stabilité multi-échantillons. https://www.microtrac.fr/fr/produits/diffusion-statique-lumiere-multiple/turbiscan-tower/ [Google Scholar]
- Lum, LUMiFuge. https://lum-france.fr/lumifuge-fr.html [Google Scholar]
- A. Cosentino, Q. Tan, M. Roussey, H.P. Herzig, J. Eur. Opt. Soc. Rapid Publ. 7, 12039 (2012) [Google Scholar]
- N. Jokerst, M. Royal, S. Palit, L. Luan, S. Dhar, T. Tyler, J. Biophotonics 2, 212 (2009) [Google Scholar]
- W. Tan, L. Shi, X. Chen, Sensors 8, 6761 (2008) [Google Scholar]
- Q. Li, V. Vié, H. Lhermite, E. Gaviot, C. Bourlieu, A. Moréac, D. Morineau, D. Dupont, S. Beaufils, B. Bêche, Sensors Actuators A: Phys. 263, 707 (2017) [Google Scholar]
- K. Malmir, H. Habibiyan, H. Ghafoorifard, Optics Commun. 365, 150 (2016) [Google Scholar]
- R. Castro-Beltrán, L. Garnier, A. Saint-Jalmes, H. Lhermite, H. Cormerais, A.-L. Fameau, E. Gicquel, B. Bêche, Optics Commun. 468, 125773 (2020) [Google Scholar]
- S. Suebka, A. Gin, J. Su, Nat. Protoc. 1, 35 (2025) [Google Scholar]
- D. Duval, H. Lhermite, C. Godet, N. Huby, B. Bêche, J. Optics 12, 055501 (2010) [Google Scholar]
- L. Garnier, H. Lhermite, V. Vié, O. Pin, Q. Liddell, H. Cormerais, E. Gaviot, B. Bêche, J. Phys. D: Appl. Phys. 53, 125107 (2020) [Google Scholar]
- A. Jada, H. Ridaoui, J.-B. Donnet, in Énergie et Formulation (EDP Sciences, 2005), pp. 78–83 [Google Scholar]
- M. Youssry, F.Z. Kamand, M.I. Magzoub, M.S. Nasser, RSC Adv. 8, 32119 (2018) [Google Scholar]
- F. Krüger, F. Beck, in New Promising Electrochemical Systems for Rechargeable Batteries, edited by V. Barsukov and F. Beck (Springer Netherlands, Dordrecht, 1996), pp. 373–389 [Google Scholar]
- T. Tamir, D.H. Auston, W. Engl, T. Sugano, H.K.V. Lotsch, in Guided-Wave Optoelectronics (Springer, Berlin, Heidelberg, 1988) [Google Scholar]
- R.G. Hunsperger, in Integrated Optics (Springer, New York, NY, 2009) [Google Scholar]
- C. Yang, in Encyclopedia of Microfluidics and Nanofluidics, edited by D. Li (Springer US, Boston, MA, 2008), pp. 1068–1076 [Google Scholar]
- C.N. Lunardi, A.J. Gomes, F.S. Rocha, J. De Tommaso, G.S. Patience, Can. J. Chem. Eng. 99, 627 (2021) [Google Scholar]
- L. Garnier, J. Gastebois, H. Lhermite, V. Vié, A. Saint-Jalmes, H. Cormerais, E. Gaviot, B. Bêche, Results Opt. 12, 100430 (2023) [Google Scholar]
- J. Gastebois, H. Lhermite, H. Cormerais, A.S. Jalmes, V. Vié, L. Garnier, B. Bêche, in Optical Methods for Inspection, Characterization, and Imaging of Biomaterials VI (SPIE, 2023), pp. 121–129 [Google Scholar]
- L. Thayyil Raju, C. Diddens, Y. Li, A. Marin, M.N. van der Linden, X. Zhang, D. Lohse, Langmuir 38, 12082 (2022) [Google Scholar]
- H.W. Seo, N. Jung, C.S. Yoo, J. Mech. Sci. Technol. 34, 801 (2020) [Google Scholar]
Cite this article as: Jordan Gastebois, Anthony Szymczyk, Gilles Paboeuf, Florian Scholkopf, Véronique Vié, Arnaud Saint-Jalmes, Herve Lhermite, Herve Cormerais, Fabienne Gauffre, Bruno Bêche, Integrated resonant structure for colloidal dispersion stability: development of a resonant optical zetameter, Eur. Phys. J. Appl. Phys. 100, 32 (2025), https://doi.org/10.1051/epjap/2025030
All Tables
All Figures
|
Fig. 1 Fabrication process of the resonant structure, along with an SEM image of an MR coupled to an access waveguide, with the geometrical parameters highlighted. |
| In the text | |
|
Fig. 2 SEM images of black carbon nano powders 1 and 2, with primary particle size and aggregate size highlighted. “Powder 1” exhibits an average primary particle size of 50 nm, whereas “Powder 2” has an average primary particle size of 80 nm. |
| In the text | |
|
Fig. 3 Nano Tracking Analysis (NTA) of black carbon “Powder 2” The average particle size (85 nm) is in good agreement with the SEM analysis. |
| In the text | |
|
Fig. 4 Optical test platform, from the broadband laser diode source (SUPERLUM) to the spectral analysis system (HR4000 spectrometer), which is connected to a computer and controlled through a real-time MATLAB interface. |
| In the text | |
|
Fig. 5 Plot of the normalized FSR evolution over time for two different concentrations of black carbon “Powder 1”: C1 and C2. |
| In the text | |
|
Fig. 6 Plot of the normalized FSR evolution over time for three different concentrations of black carbon “Powder 2”: C1, C2 and C3. The sedimentation is highlighted by the FSR increase and the associated slope which increase with the black carbon concentration. |
| In the text | |
|
Fig. 7 FFT analysis of two spectra at different time points was performed to extract the FSR and illustrate its evolution across the three concentrations C1 (left), C2 (centre) and C3 (right). |
| In the text | |
|
Fig. 8 Plot of the viscosity as a function of the shear rate for the black carbon “Powder 2” at 2 concentrations C2 and C3. An increase in the concentration increases the viscosity. |
| In the text | |
|
Fig. 9 Plot of the normalized FSR evolution over time of black carbon dispersed into water plus SDS. The ad of the surfactant stabilizes the FSR highlighted by the FFT at 2 different time. |
| In the text | |
|
Fig. 10 Electrophoretic mobility for samples at concentration C3 with (on the right) and without SDS (on the left). |
| In the text | |
|
Fig. 11 Statistical measurement of the zeta potential (on the left). Histogram representation with the stability threshold overcome by the solution with SDS. |
| In the text | |
Current usage metrics show cumulative count of Article Views (full-text article views including HTML views, PDF and ePub downloads, according to the available data) and Abstracts Views on Vision4Press platform.
Data correspond to usage on the plateform after 2015. The current usage metrics is available 48-96 hours after online publication and is updated daily on week days.
Initial download of the metrics may take a while.