Fig. 8
Download original image
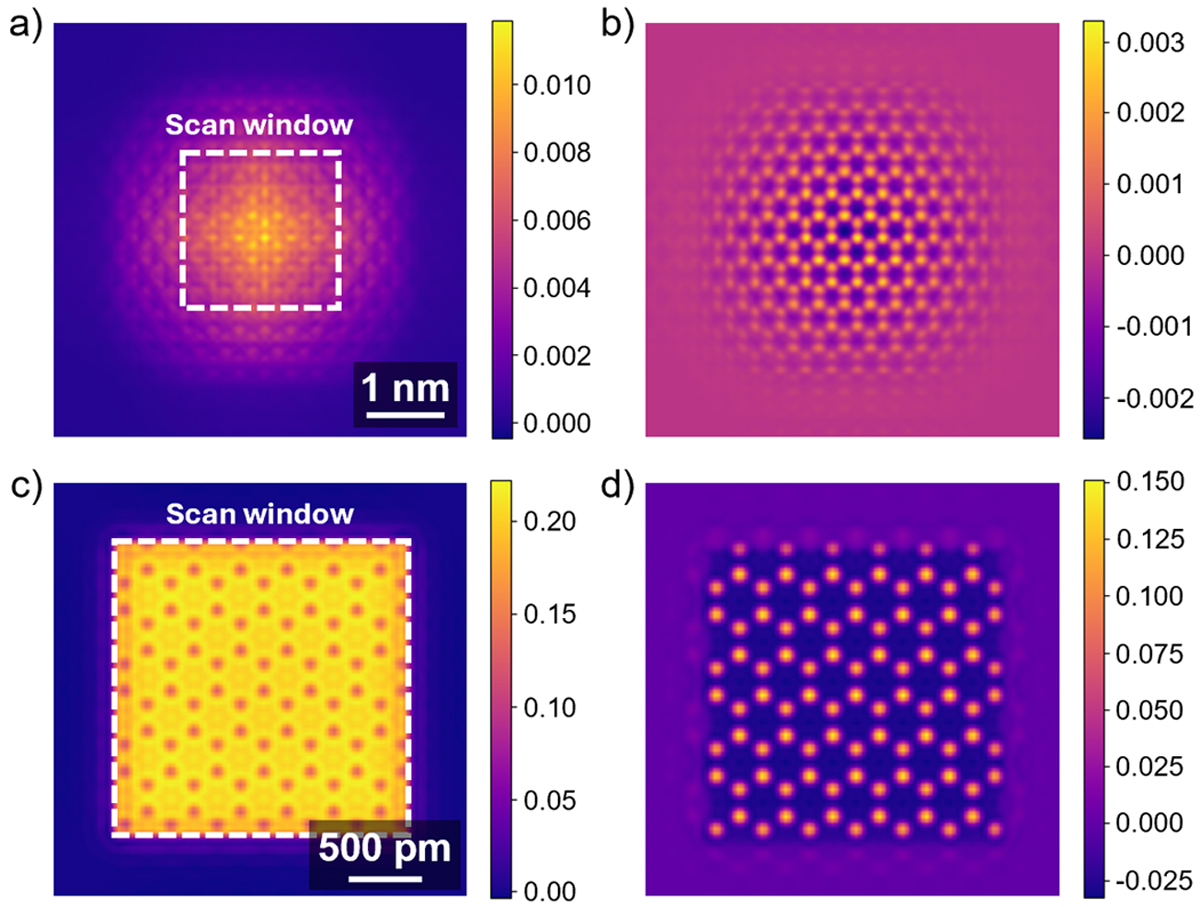
(a) Real and (b) imaginary parts of the transmission function ![]() retrieved from the overfocused simulation case, described in Section 2.2 and given
retrieved from the overfocused simulation case, described in Section 2.2 and given ![]() . The result is here visualized in an extended field of view, reflective of the larger reconstruction window. The scanned area is highlighted as well, as a white dotted square. For comparison, the (c) real and (d) imaginary parts of the transmission function recovered in the focused-probe case, as described in Section 2.1 and also given
. The result is here visualized in an extended field of view, reflective of the larger reconstruction window. The scanned area is highlighted as well, as a white dotted square. For comparison, the (c) real and (d) imaginary parts of the transmission function recovered in the focused-probe case, as described in Section 2.1 and also given ![]() , are depicted as well.
, are depicted as well.
Current usage metrics show cumulative count of Article Views (full-text article views including HTML views, PDF and ePub downloads, according to the available data) and Abstracts Views on Vision4Press platform.
Data correspond to usage on the plateform after 2015. The current usage metrics is available 48-96 hours after online publication and is updated daily on week days.
Initial download of the metrics may take a while.