Fig. 21
Download original image
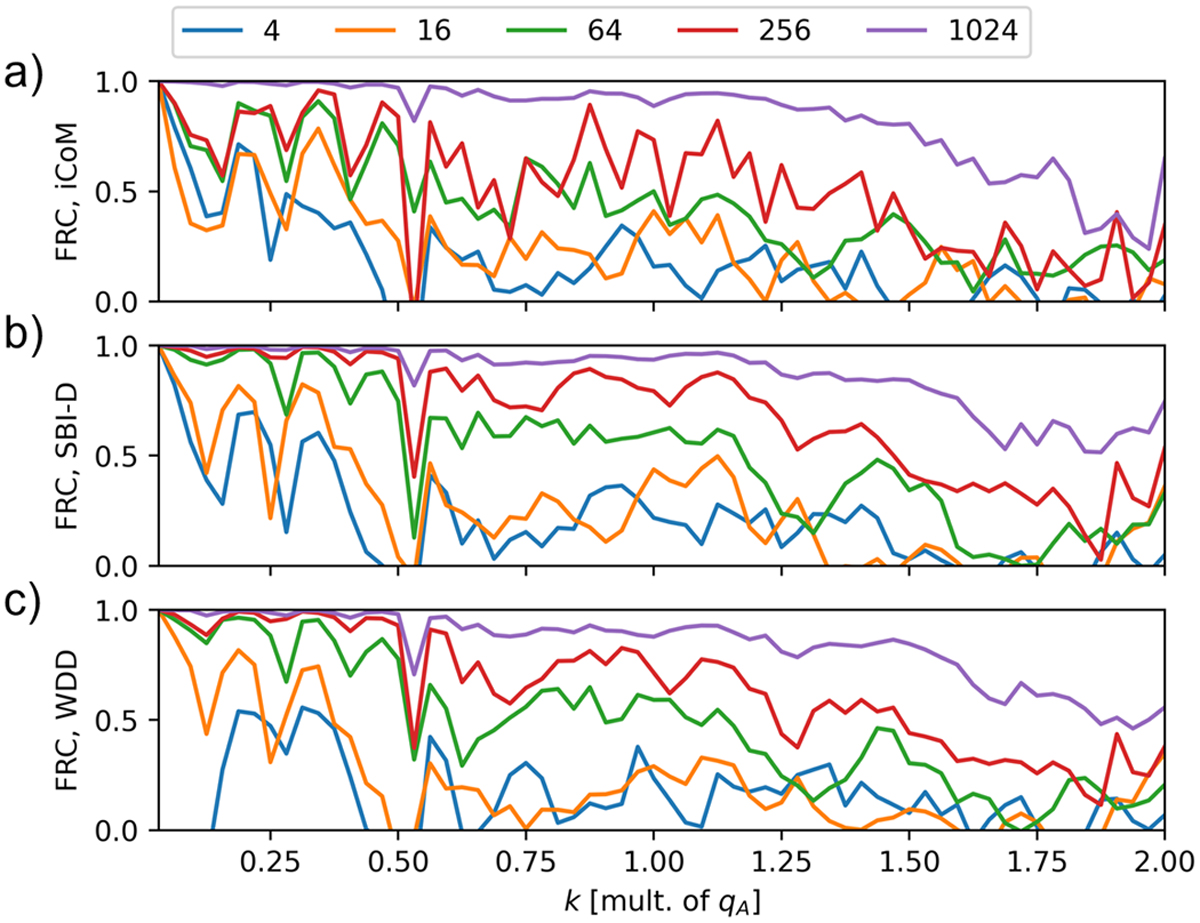
FRC calculated from the ![]() measurements presented in Figure 19, i.e. by comparing the infinite dose cases to the various dose-limited simulations. The results are plotted as a function of the reference spatial frequency k, expressed as a multiple of qA, and given for selected
measurements presented in Figure 19, i.e. by comparing the infinite dose cases to the various dose-limited simulations. The results are plotted as a function of the reference spatial frequency k, expressed as a multiple of qA, and given for selected ![]() values. The FRC calculation is displayed in (a) for iCoM, in (b) for SBI-D and in (c) for WDD.
values. The FRC calculation is displayed in (a) for iCoM, in (b) for SBI-D and in (c) for WDD.
Current usage metrics show cumulative count of Article Views (full-text article views including HTML views, PDF and ePub downloads, according to the available data) and Abstracts Views on Vision4Press platform.
Data correspond to usage on the plateform after 2015. The current usage metrics is available 48-96 hours after online publication and is updated daily on week days.
Initial download of the metrics may take a while.