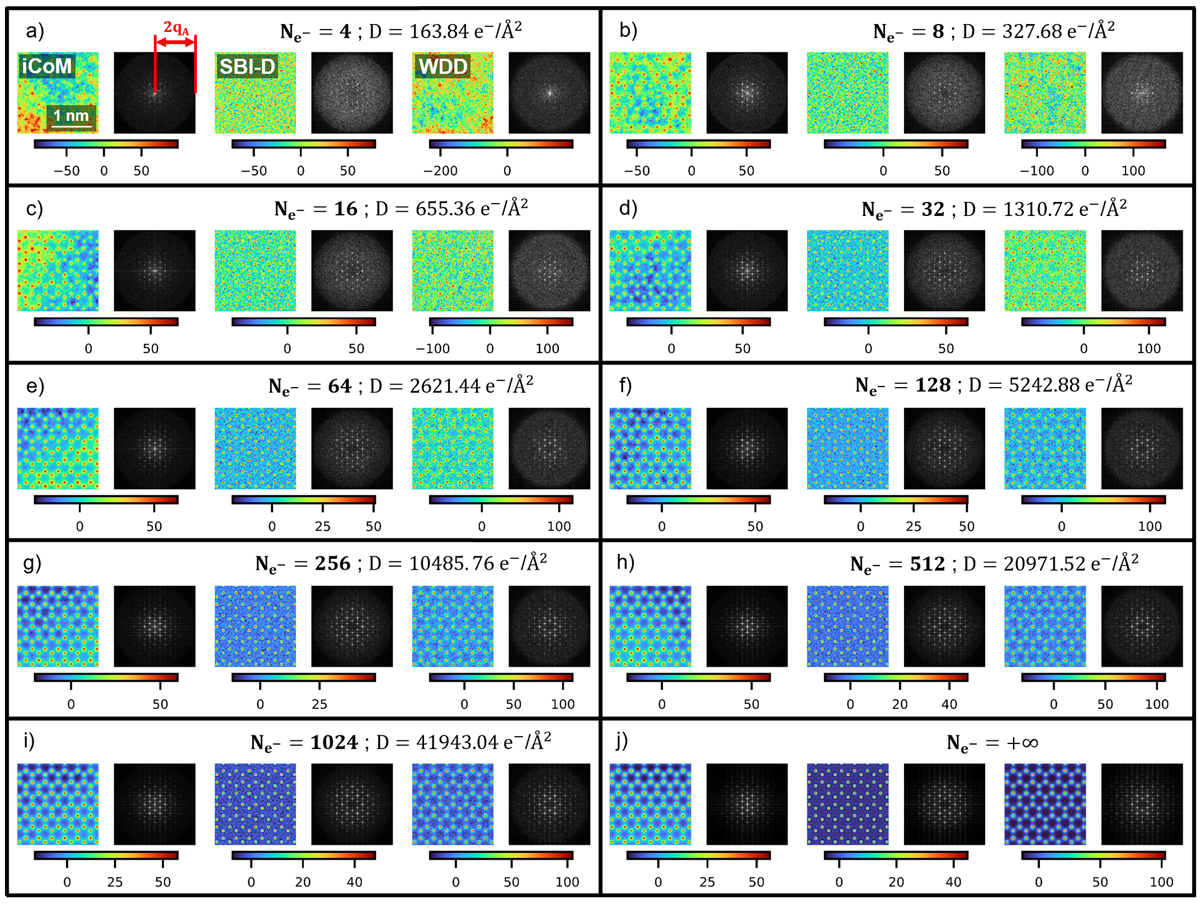
Fig. 12

Download original image
Results of analytical ptychography of monolayer MoS2, applied on the multislice electron diffraction simulation presented in Section 2.3, given α = 60 mrad. Calculations are done for a variety of average numbers of electrons per pattern ![]() , and corresponding doses D given in e−/Å2. For each case, the position-dependent measurement of the projected potential
, and corresponding doses D given in e−/Å2. For each case, the position-dependent measurement of the projected potential ![]() , through the iCoM, SBI-D and WDD methods, is displayed alongside the square root of its Fourier transform's amplitude
, through the iCoM, SBI-D and WDD methods, is displayed alongside the square root of its Fourier transform's amplitude ![]() . The colorbars reflect values of projected potential in the
. The colorbars reflect values of projected potential in the ![]() measurements, in V⋅nm.
measurements, in V⋅nm.
Current usage metrics show cumulative count of Article Views (full-text article views including HTML views, PDF and ePub downloads, according to the available data) and Abstracts Views on Vision4Press platform.
Data correspond to usage on the plateform after 2015. The current usage metrics is available 48-96 hours after online publication and is updated daily on week days.
Initial download of the metrics may take a while.


