| Issue |
Eur. Phys. J. Appl. Phys.
Volume 98, 2023
|
|
|---|---|---|
| Article Number | 49 | |
| Number of page(s) | 12 | |
| Section | Physics and Mechanics of Fluids, Microfluidics | |
| DOI | https://doi.org/10.1051/epjap/2023220304 | |
| Published online | 07 July 2023 | |
https://doi.org/10.1051/epjap/2023220304
Regular Article
Estimation of the drying process in porous media using the parallel and series moitrue transfer model
1
Beihang Hangzhou Innovation Institute Yuhang, Hangzhou 310023, P.R. China
2
Université Paris-Saclay, Centrale Supélec, ENS Paris-Saclay, CNRS, LMPS, 91190 Gif-sur-Yvette, France
3
School of Energy and Power Engineering, Beihang University, Beijing 100191, P.R. China
*e-mail: This email address is being protected from spambots. You need JavaScript enabled to view it.
;This email address is being protected from spambots. You need JavaScript enabled to view it.
Received:
7
December
2022
Received in final form:
11
February
2023
Accepted:
10
May
2023
Published online: 7 July 2023
Abstract
Moisture transfer is a very common phenomenon in a wide range of engineering fields, such as civil engineering (cement-based constructions), food processing, mining and soil penetration, drying and imbibition of porous media (including phase change materials), etc. Based on the diffusion assumptions, the classical adopted model (especially for drying) is completed by the liquid permeation. However, it is still inadequate to compromise the complexity of the porous structures. In this work, a “parallel-series” assumption of moisture transferring pattern is proposed, comprising different forms of moisture presence and the coupling styles, achieved by an interpolation factor to cover all the possible contribution ratios of the two patterns. The drying of porous material is performed under two ambient conditions over 160 days on both local and global parameters, i.e., relative humidity (RH) and mass loss (ML). In the simulation part, a nonlinear diffusion-drying model containing liquid permeation and vapor diffusion in the transfer mechanism is applied to estimate the drying process, and compared with the experiment data. Results show different tendency for the two cases of either the permeation dominating case or the no-dominating case. This approach also clarifies the transition from evaporation of weak permeability for vapor diffusivity (square root behavior) towards the linear and faster behavior, which is observed in more porous and permeable materials for the vapor diffusion.
© X. Ma et al., Published by EDP Sciences, 2023
 This is an Open Access article distributed under the terms of the Creative Commons Attribution License (http://creativecommons.org/licenses/by/4.0), which permits unrestricted use, distribution, and reproduction in any medium, provided the original work is properly cited.
1 Introduction
Similarities are observed in the drying process of many natural materials with low porosity, like soil, and in the field of civil engineering, such as concrete. In most conditions, the materials or structures are subjected to various types of environmental conditions. There are undesirable and diverse pathologies or deteriorations appearing during the lifetime of the material structure such as micro or macro-cracks, roughness, color changes, fungus developments, etc., [1–4].
In building domain, the cementitious materials (concrete) are applied in a wide range of constructions, and the durability of such material is related to safety and reliability of the structure. In most cases, they develop eventually irreversible structure damages after a long induction period [5–8]. Researching results demonstrations that the development of these pathologies is closely associated to the water distribution in the porous media and the loss of free water from pore networks will induce modification on its structural performance by various mechanisms [9–12]. Therefore, it is of most importance to predict continuous hydric state of concrete concerning to mechanical behavior and durability potential of concrete structures.
The most widely used method to obtain the internal hydric state is to follow the mass loss (ML) under drying conditions. In addition, water content profiles were also measured by researchers to validate models [13–15]. Recently improvement was introduced by considering the coupled information of ML and inner relative humidity (RH) [16,17]. It is worth noticing that the local water distribution is estimated from the local RH and the supposed sorption curve. Some indirect methods were developed to test internal humidity to complete the problem, such as electrical, electromagnetic or ultrasonic methods, X-ray computational tomography and so on [18–23]. Alternative approach includes the water contents within porous media using the NMR method [24,25].
In addition to various methods of experiment studies, different numerical approaches of modelling moisture transfer process such as drying were also developed. The updated water-vapor transferring model is characterized by rewriting a combination of vapor diffusion (Fick's law) and water displacement (Darcy's law). The equivalent diffusion coefficients are nonlinear in order to incorporate the non-saturating media effect. The water content and humidity are interlinked by the sorption curve. For the conventional drying conditions, the mass variations in drying process are mainly due to the evolution of liquid water and diffusion of water vapor. The resolution of a coupled unique nonlinear diffusion equation can be applied to obtain the water content inside concrete. This simplified approach involves only a moisture transfer coefficient that contains the diffusion (Dc) and permeability (Kc) contribution. Dc and Kc are expressed as function of saturation degree or function of humidity [26–28] and the sorption curve link the saturation degree with humidity [29–33]. The moisture transfer model containing mechanisms of diffusion and permeation is presented in equation (1).
 (1)
(1)
in which, Sl is saturation degree of liquid;h is the relative humidity; Kc and Dc are the two parts of transfer coefficients corresponding to liquid permeation and vapor diffusion, and the detailed expression will be presented in the next section; Φ*donates the inertia coefficient related to modified porosity.
This model is validated based on some basic assumptions and by adjusting the properties in order to fit with experiments. The same model was used in an inverse analysis, meaning the numerical simulation coupled with experimental results, to identify the porous material properties as equivalent diffusion coefficients [34,35]. The assumptions in equation (1) are adopted either to simplify the problem for faster calculations, or to estimate the real physics as close as possible, however, the structure complexity of porous material was mostly not considered. Such structure induces nonlinear coupling between vapor and liquid water content, which is also function of the spatial water distribution. Such water distribution is related to the capillary sizes distribution and the evaporating potential. In the admitted model, the vapor and water transfers are supposed to occur in parallel way, and the two diffusive contributions added one to the other could be restrictive.
The original model considers two phenomena − moisture diffusion and water displacement − as parallel flux (simply one term plus the other Kc + Dc), which implicitly means that the water contents and the air are continuously connected in their corresponding sub-domain. Under some circumstance, an alternative pattern (water and air domain in series) or non-connected water areas develop in the main domain and the model could became inaccurate. Due to the limitations of parallel pattern without air movement, some researchers proposed more complex models in unsaturated cement-based materials under saline environment (chloride evolution) taking into account the diffusion, the convection by moisture transport, the electrostatic coupling between ions and the chemical interactions though linear and non-linear isotherms [36]. A simplified experiment performing and analyzing the interlink connection among porous structures could refer to [16,37].
As a consequence, in Φ ɸthis work we propose the discussion on the model of the moisture transfer patterns, meaning how the liquid and vapor phases of water interact with each other and influence the humidity (water content) profiles and evolutions. Mechanisms of water transfer for the two phases (liquid water and water vapor) are discussed with respect to the possible coupling distribution patterns, i.e., either in parallel or in series way. For this purpose, an assumption of new drying model for equivalent diffusion coefficient is proposed to study how the two different patterns coupling could affect the drying tendency. In the proposed hypothesis, the two phases of water cease to interact only in decoupled way (parallel) due to the fact that the real water distribution and a partial or total series (evaporation-condensation) will be integrated.
This mechanism will be calculated and confirmed based on the cement-based materials-concrete. The used model and assumptions effect are illustrated by using experimental results as reference. Such experimental data are recorded over time of both mass loss (ML) and inner relative humidity (RH) for one-dimensional drying process in prismatic concrete specimen under two ambient conditions (T-RH = 24 °C − 45% and 38 °C − 32%). Firstly, the experimental results and identification of parameters are performed based on these two different ambient conditions. Secondly, the limitation of the classical approach is analyzed and a general formulation incorporating the possible structure is proposed, thus the model passes from parallel to serial scheme by introducing a simple weighting factor (interpolation, nint) ranging from 0 to 1. This allows to explore different volumetric distribution couplings of water, by a ratio of parallel − series patterns for the two water phases. This approach enables us to simulate and estimate the mass loss and inner humidity in drying process. This specific assumption could capture more the moisture transport in a complex porous structure. It is more comprehensive and could be closer to the reality than the original parallel model.
2 Description of the classical model
The original model, equation (1), containing two terms in the global diffusion coefficient is presented in more detailed form as below in equation (2) [35]. This equation can be expressed by either humidity (the variable adopted in this work) or local capillary pressure.
 (2)
(2)
The kla and Dva are apparent permeability of liquid water (m2), and apparent diffusivity of water vapor (m2/s), respectively, which govern the transfer process in the porous material. The complexity lies in that both of the two terms are functions of the saturation degree, or the relative humidity. Parameters ρl and ρv denote the density of liquid and density of vapor (kg/m3), respectively, and μl is the water dynamic viscosity (Pa ⋅ s). Φ is porosity of the porous materials; Sl represents the saturation degree of liquid; h is the relative humidity; pvs is the saturated vapor pressure (Pa); Mv is the molar mass of water (g/mol), and R denotes the gas constant.
In equation (2), the right-hand side represents the transfer of moisture and the water content (capillary pressure potential) over the domain. The two variables (humidity and water content) are interlinked by the sorption curve on left-hand side of this equation (∂Sl/∂ h), which enables to couple the evolution of the humidity, water content and capillary pressure. The two main mechanisms considered, i.e., liquid permeation along the pores and vapor diffusion through the void (in Eqs. (1) and (2)), are represented by using the equivalent diffusion terms for vapor diffusion Dc, and water displacement Kc, as expressed in equations (3) and (4).
 (3)
(3)
 (4)
(4)
On the other hand, during the drying process, pores are gradually dehydrated, and the flux of water vapor transfer obeys the Fick's law. The apparent diffusion coefficient Dva can be related to saturation degree by the empirical Millington and Quirk (MQ) relationship [28], as expressed in equation (5). In this equation, amq and bmq are two fitting parameters, and D0 is diffusion coefficient of vapor in air, which is dependent on temperature, as expressed in equation (6), where T0 (273 K) is the reference temperature and T is the air temperature.
 (5)
(5)
 (6)
(6)
Relationship between the degree of saturation and relative humidity is given by equation (7) [31], where avg and bvg are fitting parameters according to experimental desorption isotherm.
 (7)
(7)
The relative permeability kla, is function of water through the saturated porous structure, equation (8), k0 is the intrinsic permeability of porous media, and pkrl and avg are fitting parameters.
 (8)
(8)
In addition, there exists a boundary thickness depending on the convectional ambient condition. It is a complex result related to air flow, ambient temperature; and also surface condition of the material, like roughness [35,38]. The air flux at the interface between the sample and the air can be expressed by equation (9).
 (9)
(9)
in which, JB denotes the flow of water vapor at the air-concrete external interface; A is the surface; ℏc is the interface convective coefficient (g/m2s) and hext (hs) is the external (saturated) relative humidity, i.e. ambient humidity.
3 Experiment and identification
The porous material used in this experiment is concrete with low porosity (with the porosity value Φ = 12.4%). The cement type is CEM II Airvault Calcia, and w/c equals 0.573. the porous size distribution is approximately between 0.1 and 100 μm. The ingredient, properties and preparation of concrete blocks are introduced in previous work [35]. Here the prismatic samples are used (28×7 ×7 cm3, as presented in Fig. 1) and in order to guarantee a one-dimensional drying process, the four surfaces along the length direction are tightly covered by aluminum paper, which is impermeable of water. The sample was initially conserved in water, which could be considered as very close to saturated initial condition, and the corresponding initial relative humidity in simulation has taken the value of 99.5% RH. At the beginning of the experiment, they are placed in the climate chamber at fixed ambient conditions. During the long drying process, both mass loss (loss of water) of the sample and relative humidity at specific position are recorded regularly.
The constant ambient condition is guaranteed by the climate chamber (type: Memmert HPP260, see Fig. 1) with the temperature range from 5 °C to 70 °C, and precision of ±1 °C; and the relative humidity ranges from 10% to 90%, with a precision of ±0.5%. The humidity-temperature sensor incorporated at a fixed position within the sample is a capacitive humidity sensor (type Ahlborn FHA 646R, the physical picture is shown on top-right of Fig. 1). The application range for relative humidity is from 5% to 98%, with a precision of ±2% (when RH ≤ 90%), and the application range for temperature measurement is from −30 °C to +100 °C, with a precision of ±0.1 °C.
The recorded experimental data (mass evolution and local humidity profiles) are coupled with the numerical solution of equation (1), and solved within Cast3M [39], in order to identify the porous media properties (including coefficients in sorption curve, intrinsic permeability, convection coefficient, and parameters in vapor diffusivity inside concrete). Such identification procedure coupling finite element modelling and experimental results [40], is based on the minimization of an error function (differences between data obtained from experimental work and numerical results) using MATLAB algorithm. The more detailed calculation processes can refer to the previous work [17,35].
The experimental results of mass loss (ML) and relative humidity (RH) at the specific position (1.5 cm to the drying surface) are presented in Figure 2 for two T-RH ambient conditions (38 °C − 32% RH and 24 °C − 45% RH). The comparison of experiment and simulation results shows global favorable agreement for both ML and relative humidity RH tendency within the test durations.
As expected, the relative mass loss increases with time for both ambient conditions. In addition, for the case of 38 °C, 32% RH, both mass loss and humidity change faster than the other, due to the higher partial pressure gradient between the sample and the ambience. The potential pressure difference is represented in the insert graph of Figure 2a. This inserted graph of T-RH humid air diagram illustrates the resulting pressure difference between the liquid gas interface and the ambient conditions. It is apparently suggested from this graph that the driving potential (humidity gradient) is higher for the first ambient condition (red color), which naturally leads to a faster drying phenomenon. Another contribution factor is that the high temperature ambient will enhance the water vapor diffusivity dynamics.
It is noteworthy that two evolutions of global variable are used: they are the sample mass as a volumetric integral information and the inner humidity as a local information. The combination of the two parameters is necessary to avoid the multiple possible water distributions corresponding to the same total mass evolution. Based on the satisfactory agreement evolution (using the identified parameters), it is indicated that different regimes are observable between the early and late ML evolution (Fig. 2a). The model is just able to find a compromise and the tendency is overestimated in mid time (∼30 days) and underestimated later (after 120 days). The same tendency is observed on the relative humidity (Fig. 2b) where RH decreases fast in the early time, almost linear tendency in the middle period (10–30 days) and difference appears in later time, i.e. especially for the blue line (24 °C − 45%RH). The identified (minimization numerical/experimental) porous media properties for the two used boundary conditions are presented in Table 1.
The comparison of parameters implies a significant difference in the material properties and the boundary condition adjustment. Changes in sorption curve or permeability are contributing to the model for fitting with the experimental data. Such discrepancy in the identified properties illustrates clearly the limitation of the model in predicting the drying process under different conditions. The weak convective coefficient, ℏc, values illustrate the quite week diffusive ambient condition and therefore could be ignored.
For the case of high driving potential (38 °C − 32% RH), a relative fast transient drying regime occurs (red line in Fig. 2a). The corresponding local water content, the inner water redistribution (flow under capillary forces) time coupled to the local sorption equilibrium do not allow to reach equilibrium local average water-content/humidity. The resulting local water distribution and corresponding pattern is related to such transient phenomena and possible time delay. Such complex pattern water distribution can contradict the model assumption. This can explain the observed change (Tab. 1), more than a double, in the identified permeability value and sorption curve coefficient for 38 °C − 32% RH and 24 °C − 45% RH.
Based on the discussed methodology and limitations, we'll propose the discussion about the influence of such patterns on the equivalent coefficient and how the transfer will develop for more complex water distribution styles instead of the parallel approach (spatial separated phase). This discrepancy of the identified parameters will be analyzed under other modulization assumptions in the next section.
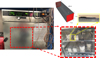 |
Fig. 1 The climate chamber used in drying, the prismatic porous media (concrete) with embedded sensor [35]. |
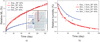 |
Fig. 2 Experimental and numerical results of mass loss (a) and relative humidity evolution (b). |
4 Generalization of the ‘parallel-series' model
The improvement of the classical drying model and the discussion on moisture transfer patterns will be presented in this part. Several assumptions were adopted in this moisture transfer model: one of the most idealizing assumptions is that permeation of liquid and diffusion of vapor take displacement in their own local domains, and there is no interaction between each other (excluding the sorption curve). We name this decoupling approach as “parallel” pattern, as showed in Figure 3a. This situation could be appropriate for a porous media with two separated capillary sizes structures. In such situation, it is obtained a large dry continuous capillary domain (or percolated porous cavities) allowing the continuity of vapor diffusion and a second interconnecting small capillary that mainly contains or redistributes the liquid water due to the significant capillary pressure. Consequently, in such case, the two contributing terms are summed up directly, and the global diffusion coefficient is expressed as equation (10).
 (10)
(10)
For the physical significance, the pathways for water vapor and for liquid water are independent, and no interactions exist between the two expressed fluxes. Nevertheless, the following coupling remains:
one is the sorption curve, i.e. the humidity and water contents are in equilibrium, transfer from liquid water to vapor;
the other indirect interlink exists, which is the apparent coefficients kla, and Dva, as they are function of saturation degree (Sl).
In reality, the inner structure of the porous media is more complex than a continuous bi-distribution in size, and it is reasonable to have several layers of liquid-bridge (or isolated saturated areas) appearing in the pore networks and vapor among them. In such circumstance, the moisture transfer pattern could behave as in “series” way due to the two phenomena's interaction (evapo-condensation), as showed in Figure 3b. As a matter of fact, the most probable condition is that both of the two transfer patterns contribute to the global moisture transfer process with a certain proportion (see Fig. 3c), based on the inner porous structure and on the level of water contents (between the dry and the saturation).
The last presented one, named as “parallel-series” pattern, means the terms of vapor diffusion and liquid permeation are coupling in either parallel way, series way, or the mixing of the two. So, the main question lies in “what is the sensitivity of the previously identified porous media parameters under different assumptions?”. The change from the parallel to series assumption passing by the series-parallel drying pattern will be discussed below and how the changes in such assumption could affect the phenomena.
Therefore, an analogy method is proposed in this work to consider this contribution ratio by a possible unique coefficient (nint) to model such complexity. In real situation this proportion of series-parallel will change with the water content. Such auto-adjustment of the proportion of series-parallel to the water content level, i.e., nint(Sl) is not integrated. Figure 3 summarizes the previously introduced possible coupling from parallel to series patterns. R is the transferring resistance in the region for the corresponding transfer patter, and it is the reciprocal of transfer coefficient (Kc or Dc). The used subscripts “p, s” donate parallel and series, respectively; “l, v” represent liquid and vapor, respectively; A is the local cross section of transferring path and d is he used scale to express the local resistance.
As mentioned previously, the equivalent transfer coefficient in parallel case (Fig. 3a) is given by Deq (Deq = Dc + Kc), and the equivalent expression for serial situation (Fig. 3b) is  .*
.*
To pass from parallel to series and describe proportion of parallel and series contributing ratio (Fig. 3c) to the global drying process, an interpolation factor nint is involved, as expressed in equation (11).
 (11)
(11)
This new proposed approach could fit better with the real complexity of the structure. However, it remains a challenge to know the exact contributing ratio of the two patterns in such complex porous system and dynamic process. Therefore, we apply the interpolation factor nint to vary the different ratios of the two style that controlling the equivalent diffusion coefficient Deq. By updating the model (Eq. (2)) with the new coefficient (Eq. (11)), how the two phenomena affect the mass loss and relative humidity evolution can be achieved. It is notable that the coupling could be more complex and the relative mixing between series and parallel could be function of the water content level, i.e. nint(Sl).
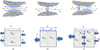 |
Fig. 3 Schematic diagram of moisture (vapor) and water (liquid) transfer in different topologies, in parallel (a), series (b) and the combination of the two (c). |
5 Results and discussion
As a key parameter controlling the modulization of drying process, equivalent diffusion coefficient Deq is a combination factor of two parameters (Dc, Kc). Depending on the porous media structure (porosity, tortuosity, capillary distribution) and the ambient conditions (boundary conditions), the two contributing terms (Dc, Kc) are always coupling and competing to contribute to the ratio of the equivalent diffusion coefficient term (Deq). This equivalent diffusion coefficient is simplified as a mixture of parallel- series coupling by the interpolation factor nint, as showed in equation (11).
In order to analyze the two cases which are frequently encountered, and close to what was identified in the two previously analyzed experimental boundary conditions (Tab. 1), we will consider the permeation to diffusion dominating case and the second case of comparable effect (equivalent weight). In each case, the equivalent coefficient will be recalculated with different interpolation factors, i.e. the contribution ratios from parallel to series style.
The results will provide the information that how the equivalent diffusion coefficient will be affected by the transferring style in the porous structure. Furthermore, the corresponding mass loss and relative humidity profiles for each recalculated Deq will be obtained and presented accordingly, which provide as more direct results that are influenced by the transferring patterns. By this approach, the goal is to underline the limitation and sensitivity of the classical parallel approach. The second strategy of the two possible strategies is adopted and presented below:
using the experimental available data, we identify the new transfer coefficient for possible water distribution/structure under different nint. So, the chosen model effect will be obvious on the new identified properties (equivalent of what we did in previous section for two boundary condition and using the parallel standard approach).
Or keeping the transfer coefficient previously identified and by changing the nint, (i.e. possible water distribution/porous structure), the corresponding equivalent properties effect on the obtained simulated ML and RH are analyzed.
5.1 Permeation dominating case (Kc « Dc)
The profile of equivalent diffusion coefficient and the two contribution terms are shown for nint = 1 (parallel case) in Figure 4a. Under the ambient condition (24 °C, 45%RH), it is clearly displayed that the permeation of liquid water (Kc) is one order of magnitude higher in dominating role in comparison with the diffusion of vapor term (Dc). A set of optimized values that fit well with the experimental results on both mass loss and relative humidity were obtained from the optimization process (see Tab. 1, Fig. 2).
Therefore, the global coefficient under the classical model (parallel pattern: Deq = Dc + Kc) is mainly controlled by the permeation profile (Fig. 4a). The water permeation is less sensitive to RH than the vapor diffusion. This is natural as humidity will stop contributing when situation tends to 100%RH (liquid saturated porous media). In the considered case (Kc ≫ Dc), physically it means that the water is evaporating mainly on the external sample surface and the water is continuously redistributed over the volume, moving from deep internal toward the external surface submitted to convection. Figure 4a corresponds to the case of nint = 1, which is the classically adopted assumption in the original models [16,41–43].
By applying different interpolation values (nint) ranging from 0 to 1 in equation (10), the corresponding equivalent diffusion coefficient versus humidity will be obtained, as showed in Figure 4b. The profiles changes from solely parallel style to solely series style when interpolation value ranging from 1 to 0.
It suggests a strong effect of the considered model on the equivalent coefficient controlling the drying process. The effect is both on the value (order of magnitude) and on the tendency with a sudden decrease and increase of the equivalent coefficient in the vicinity of the humidity boundaries. It also indicates that with the smaller value of interpolation factor (more ratio of series transfers pattern), the equivalent diffusion coefficient varies in relative lateral decreasing way, which leads to a weaker and weaker ability in moisture transfer, especially for high water contents (interface in the bulk of the porous material). As a consequence, the transfer ability decreases and the mass loss rate, on the whole domain, decreases (see Fig. 5a).
The spatially structured water content within porous media as liquid bridges induces such more series transfers. The corresponding simulated local humidity (Fig. 5b, point at 1.5cm from external drying surface) will decrease in less pronounced way, which is coherent with the effective diffusion decreases. It has been mentioned that the high-water contents contribute to the significant decrease of the equivalent diffusion. The relative humidity in Figure 5b shows the saturating state remaining for almost 60 days as the water distribution by Darcy flow (capillary pressure) became impossible due to the series approach.
On the other hand, equation (11) can be rewritten with respect to nint, which is treated as variables, as shown in equation (12).
 (12)
(12)
where A = (Dc + Kc) − B and  .
.
In the current case, Dc ≪ Kc is considered, so B tends to zero, the expression of Deq will be simplified as:
 (13)
(13)
So Deq is function mainly of Kc, which is linked to the time and evolving water content (i.e. h), so the model can be rewritten as the following format, equation (14).
 (14)
(14)
In such porous media situation, where water vapor diffusion contribution is negligible in comparison with the permeation ability of liquid water, the global behavior can be deduced from such the water content distribution expressed by the interpolation values. By introducing dimensionless time t* = nint ⋅ t, a set of uniformed results can be always found from the model  . The parallel-series contribution keeps only part of the permeation ability of liquid water. This behavior is verified by the simulation results of both ML and RH as shown in Figures 6a and 6b, respectively.
From the unified results of mass loss and relative humidity versus modified time, the unique evolution can be obtained and the uniformity doesn't rely on the interpolation factors, as showed in Figure 6. The effect of humidity on the Deq is more significant with nint decrease (as also shown in Fig 5) and it indicates why the unified profile is not so perfect due to the nonlinear behavior of this model. It is also suggested that such deviation will be less if a more dominant case (Kc ≫ Dc) is considered.
The results of relative humidity in Figure 6b presented similar uniformity as results of mass loss. However, the local variability is more obvious than the integral concept of global mass loss. The evolution of relative humidity is more pronounced over time, which illustrates the local increase of equivalent diffusion coefficient for nint close to zero (Fig. 4b).
From this situation also it can be deduced that (by equivalence) the other limit case Dc ≫ Kc. The same expression of Deq is obtained (simplified as previous, Eq. (12)): Deq = nint × A. The only difference is that A (so Deq) is function mainly of Dc instead of Kc.
In this section, we proposed the interpolation factor to express the contribution ratios of parallel or series patterns in the transfer process. Based on the widely acknowledged model, the equivalent diffusion coefficient can be rewritten considering the different contribution ratios and simulate under the ambient condition of 24 °C, 45%RH. Results show a dominant role of liquid permeation to the vapor diffusion, which leads to the divergent curves of equivalent coefficient for different contribution ratios of parallel to series patterns. Consequently, the RH and ML appear the same tendency due to the equivalent coefficient effect. Nevertheless, due to the negligible order of magnitude for one contribution term (Dc), the equivalent diffusion coefficient can be simplified and renewed in the model calculation, all the RH and ML curves under different interpolation factors can be unified by introducing a dimensionless time (t* = nint ⋅ t). This explains when using identification, a different Kc can be obtained as consequence of the water content patterns (nint).
The simulation results of the second boundary condition (38 °C, 32%RH) provides a different characteristic of the equivalent coefficient tendency, the results and analysis will be presented in the following section.
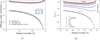 |
Fig. 4 The diffusion coefficient terms (Dc, Kc), and the equivalent term (Deq) as function of RH in parallel approach (a) and parallel-series approach (different interpolations) (b); for Exp. BC 24 °C, 45%RH. |
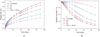 |
Fig. 5 Effect of parallel/series ratio on simulated ML (mass loss) (a) and RH (relative humidity) (b); for Exp. BC 24°C, 45%RH. |
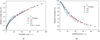 |
Fig. 6 Uniformed mass loss a) and relative humidity b) with different interpolation values. |
5.2 Case of no predominating term (Kc ≈ Dc)
For the ambient condition of 38°C, 32%RH, the two contribution terms in diffusion coefficient profile are presented function of humidity in Figure 7a. It is indicated that the permeation of liquid water (Kc) and the diffusion of vapor term (Dc) are relatively in the same level when the relative humidity is lower than 0.8. In comparison with the permeation dominating case, it is indicated that both of them contribute to the global diffusion coefficient in the same order of magnitude, except when the relative humidity reaches as high as close to 1. Above 80% of humidity, the permeation of liquid controls the phenomena and the value increases significantly (more than one order of magnitude). Therefore, we will recover locally the previous discussed behavior (dominant permeation and partial time transformation) where the redistributing water is very strong in such level of water content.
In this circumstance, the same interpolation method is applied to obtain the equivalent diffusion coefficient under different contribution ratios of parallel and series (different interpolation values), as shown in Figure 7b. It suggests that when Dc and Kc are relatively equal to each other, Deq will be independent of interpolation value nint. in a large range of relative humidity (from 0.3. to 0.8). To a certain degree, it means regardless of the proportion of parallel and series way contributing to moisture transfer, the equivalent diffusion coefficient will be the relatively constant as the combination of permeation term (Kc) and diffusion term (Dc), which is still a function of saturation degree. It is indicated that Deq ≈ 2Kc, or Deq ≈ 2Dc. However, when relative humidity is higher than 0.8, the equivalent relative humidity begins to separate and only in this range the big difference appears for different interpolation values.
The series-parallel effect, as previously illustrated, permits to explore porous structure whether more of the permeation or diffusion that control the phenomenon. For nint higher than 0.2, it's obvious that the permeation is controlling physics and we recover the strong permeation enhancement for humidity above 0.8. It is also important to see asymptotic situation of strong change in Dc, Kc and almost constant Deq for nint ∼ 0.1. The constant diffusion on large humidity value will exhibit an ML as square root of time, see Figure 8a. Consequently, the simulation results of ML and RH behave high consistence for all the interpolation factors, owing to the constant equivalent diffusion coefficient in the focused range of relative humidity. The simulation results of ML and RH with different interpolation values are shown in Figures 8a and 8b, respectively. The increase of Deq with nint enhance the ML. However, the humidity dependency is obvious and it modifies the ML evolution (Fig. 8a). The ML increases slower with the decrease of interpolation coefficient. The induced decrease in equivalent diffusion (Fig. 7b) will inhibit the ability of losing water. We can also see that the ML is double of the one obtained in previous section because the present Deq is almost 10 times bigger than that of permeation dominant case (Kc ≫ Dc, Fig. 5).
Due to the fact that the humidity recording point is very close to the drying surface (1.5 cm), the time for humidity decrease from 100% to 80% is relative short in comparison to the scale of the whole drying period (see Fig. 8b). Therefore, below a humidity level of 80%, the equivalent diffusion coefficient is relatively constant, which accounts for the consistent decreasing profile of relative humidity, as showed in Figure 8b, i.e. the change of Deq is included again as an insert. The interpolation effect appears much more noticeable for the permeation dominating case (compare Fig. 8b and Fig. 5b). This no predominating term (Kc ≈ Dc) corresponds to almost constant value and correction for humidity above 80% given by Deq =  , which comes from the simplification of equation (11) under the considered case. Consequently, for Kc ≈ Dc, B ≈ 2Kc ≈ 2Dc; A = 2Dc − 2Dc ≈ 0; and from Deq = nint × A + B we get Deq ≈ B. For this second case, the diffusion is stronger, resulting to a faster drop of relative humidity (Figs. 2b 8b) and stronger ability of moisture distribution inside porous structures.
The previous identified Sl, Kc and Dc using the simplified parallel approach, as discussed, exhibit difference of two orders of magnitude. The application of the new parallel-series approach can explain and reduce such difference on considered material properties. Such a parallel-series approach brings the equivalent transfer to the same order of magnitude as illustrated in Figure 9. One of the cases (first) is close to the parallel approach where the evaporation is slower and time allows water displacement and redistribution from the big to smaller capillaries (pore size distribution). The second case characterizes a more significant evaporating potential trend toward more serial transfer (liquid bridge and separate domain with sudden change in water content).
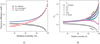 |
Fig. 7 Contribution terms (Dc, Kc) in equivalent diffusion coefficient (Deq) function of RH, Parallel approach (a) and Parallel-Serie approach (different interpolations) for 38 °C, 32%RH. |
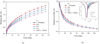 |
Fig. 8 Simulation results of mass loss (a) and relative humidity (insert of Deq function of RH) (b) with different interpolation for the case Kc ∼ Dc. |
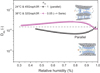 |
Fig. 9 Comparison of equivalent diffusion coefficient in both boundary condition cases. |
6 Conclusions
This work mainly proposed and verified an assumption of “parallel-series” moisture transferring transfer model, which is characterized by a nonlinear diffusion coefficient. The obtained experiment results under two ambient conditions demonstrates the limitation of the classical approach because the identified porous media parameters are dependent on the boundary condition, which is not supposed to be the reality due to the intrinsic property of the material. The order of magnitude of the two terms for vapor diffusion and liquid permeation allows to define the transferring style as permeation dominating pattern and the no-nominating pattern.
On one hand, the evolution of ML and RH versus time can be predictable for any ratio that contributes from parallel and series style. On the other hand, if there is no predominating term, a set of relatively consistent ML and RH profiles can be obtained whatever is the interpolation values. Therefore, the parallel and series assumption could serve as a logical approach to analyze how proportion of contribution of vapor and liquid affect the drying phenomenon.
To summarize, this approach allows to keep the consistence: during identification for several boundary conditions, it becomes possible to find the same physical material properties (permeability, intrinsic and related parameters and the sorption coefficients for different corresponding nint). The water contents patterns changing with boundary conditions are expressed through the introduced interpolation series-parallel coefficient. Furthermore, moisture transfer phenomena are function of the real water content distribution, which is evolving over time and the challenge is to link these resulting patterns to the corresponding parallel and series contributions. The perspective is to express overtime the nint to the water content. However, this proposed approach is useful to analyze the model within our interested humidity range (higher than 30%). In addition, it is related also to the interconnections and the pore distributions, which is one of the main characteristics controlling the water displacement.
Author contribution statement
Xiaoyan Ma: conceived and designed the experiments; performed the experiments; analyzed and interpreted the data; wrote the paper.
Rachid Bennacer: conceived and designed the experiments; analyzed and interpreted the data; contributed reagents, materials, analysis tools or data; wrote the paper.
Farid Benboudjema: conceived and designed the experiments; analyzed and interpreted the data.
Longfei Chen: analyzed the data; reviewed the paper.
Nomenclature
A: Cross section of transferring path
avg, bvg: Fitting coefficient from experimental desorption isotherm
pkrl: Fitting parameter for permeability
kla: Porous media apparent permeability (m2)
Dva: Porous media apparent water vapor diffusivity (m2/s)
D0: Diffusion coefficient of vapor in air (m2/s)
Dc: Diffusion transfer coefficient for vapor phase
Kc: Permeability transfer coefficient for liquid phase
k0: Intrinsic permeability of porous media (m2)
nint: Coefficient of proportion series-parallel
ρl: Density of liquid water (Kg/m3)
ρv: Density of water vapor (kg/m3)
μl: Water dynamic viscosity (Pa.s)
Φ: Porosity of the porous materials
Sl: Saturation degree of liquid
h: Relative humidity
ℏc: Convective coefficient (g/m2s)
pvs: Saturated vapor pressure (Pa)
Mv: Molar mass of water (g/mol)
R: Gas constant
T0: Reference temperature (273 K)
T: Ambient (air) temperature (K)
Subscripts
ap: Apparent
eq: Equivalent
c: Convection
l, v: Liquid and vapor
p, s: Parallel and series
References
- T. Jávor, Mater. Struct. 19, 401 (1986) [CrossRef] [Google Scholar]
- T. Jávor, Mater. Struct. 24, 253, 1991 [CrossRef] [Google Scholar]
- K. Kovler, V. Chernov, in Woodhead Publishing Series in Civil and Structural Engineering, N.B.T.-F. Delatte Distress and Repair of Concrete Structures (Woodhead Publishing, 2009), pp. 32 [CrossRef] [Google Scholar]
- V.C. Li, Engineering 5, 250 (2019) [CrossRef] [Google Scholar]
- M. Usman, M. Yaqub, M. Auzair, W. Khaliq, M. Noman, A. Afaq, Constr. Build. Mater. 272, 121984 (2021) [CrossRef] [Google Scholar]
- M. Collepardi, Concr. Int. 21, 69674 (1999) [Google Scholar]
- S. Diamond, Cem. Concr. Compos. 18, 205 (1996) [CrossRef] [Google Scholar]
- H. Wang, J.E. Gillott, Cem. Concr. Res. 21, 647 (1991) [CrossRef] [Google Scholar]
- Z.P. Bažant, X.I. Yunping, Mater. Struct. 27, 3 (1994) [CrossRef] [Google Scholar]
- J.-K. Kim, C.-S. Lee, Cem. Concr. Res. 28, 985 (1998) [CrossRef] [Google Scholar]
- B.D. Liu, W.J. Lv, L. Li, P.F. Li, Constr. Build. Mater. 69, 133 (2014) [CrossRef] [Google Scholar]
- O.E. Babalola, P.O. Awoyera, D.-H. Le, L.M. Bendezú Romero, Constr. Build. Mater. 296, 123448 (2021) [CrossRef] [Google Scholar]
- V. Baroghel-Bouny, Cem. Concr. Res. 37, 438 (2007) [CrossRef] [Google Scholar]
- Z. Zhang, M. Thiéry, V. Baroghel-bouny, Cem. Concr. Res. 57, 44 (2014) [CrossRef] [Google Scholar]
- N. Ben Abdelouahab et al., Cellulose 28, 1 (2021) [Google Scholar]
- J. Carette et al., Constr. Build. Mater. 230, 117001 (2020) [CrossRef] [Google Scholar]
- X. Ma, J. Carette, F. Benboudjema, R. Bennacer, Constr. Build. Mater. 256, 119421 (2020) [CrossRef] [Google Scholar]
- Q. Huang, Z. Jiang, X. Gu, W. Zhang, B. Guo, Cem. Concr. Res. 67, 31 (2015) [CrossRef] [Google Scholar]
- J.L. Granja, M. Azenha, C. De Sousa, R. Faria, J. Barros, J. Adv. Concr. Technol. 12, 250 (2014) [CrossRef] [Google Scholar]
- J. Zhang, J. Wang, Y. Han, Constr. Build. Mater. 96, 599 (2015) [CrossRef] [Google Scholar]
- Z.M. Sbartaï, S. Laurens, J. Rhazi, J.P. Balayssac, G. Arliguie, J. Appl. Geophys. 62, 361 (2007) [CrossRef] [Google Scholar]
- I. Jerjen, L.D. Poulikakos, M. Plamondon, P. Schuetz, T. Luethi, A. Flisch, Phys. Proc. 69, 451 (2015) [CrossRef] [Google Scholar]
- Z.-M. Sbartaï, D. Breysse, M. Larget, J.-P. Balayssac, Cem. Concr. Compos. 34, 725 (2012) [CrossRef] [Google Scholar]
- H. Justnes, I. Meland, J.O. Bjoergum, J. Krane, T. Skjetne, Adv. Cem. Res. 3, 105 (1990) [CrossRef] [Google Scholar]
- A.T. Watson, C.T.P. Chang, Prog. Nucl. Magn. Reson. Spectrosc. 31, 343 (1997) [CrossRef] [Google Scholar]
- P. Rossi, Engineering 17, 93 (2021) [Google Scholar]
- Z.P. Bažant, L.J. Najjar, Cem. Concr. Res. 1, 461 (1971) [CrossRef] [Google Scholar]
- B. Perrin, V.B. Bouny, L. Chemloul, Mater. Struct. 31, 235 (1998) [CrossRef] [Google Scholar]
- Z. Zhang, M. Thiery, V. Baroghel-bouny, Cem. Concr. Res. 89, 257 (2016) [CrossRef] [Google Scholar]
- Y. Mualem, Water Resour. Res. 12, 513 (1976) [Google Scholar]
- M.T. Van Genuchten, Soil Sci. Soc. Am. J. 44, 892 (1980) [CrossRef] [Google Scholar]
- R.J. Millington, J.P. Quirk, Trans. Faraday Soc. 57, 1200 (1961) [CrossRef] [Google Scholar]
- H.H. Gerke, M.T. van Genuchten, Water Resour. Res. 29, 305 (1993) [CrossRef] [Google Scholar]
- C. Zhou, Cem. Concr. Res. 58, 143 (2014) [CrossRef] [Google Scholar]
- X. Ma, Experimental and numerical study on moisture transfer dynamics in multi- scale porous cementitious materials, University Paris-Saclay (2020) [Google Scholar]
- H. Sleiman, O. Amiri, A. Ait-Mokhtar, J.-M. Loche, Mag. Concr. Res. 64, 351 (2012) [CrossRef] [Google Scholar]
- R. Bennacer, X. Ma. Constr Build Mater. 323, 126479 (2023) [Google Scholar]
- Z. Zhang, M. Thiery, V. Baroghel-bouny, Cem. Concr. Res. 68, 10 (2015) [CrossRef] [Google Scholar]
- CEA, “CAST3M.” p. http://www-cast3m.cea.fr (2017) [Google Scholar]
- J. Neggers, J.P.M. Hoefnagels, M.G.D. Geers, F. Hild, S. Roux, Int. J. Numer. Methods Eng. 103, 157 (2015) [Google Scholar]
- J.-P. Carlier, T. Rougelot, N. Burlion, Constr. Build. Mater. 37, 58 (2012) [CrossRef] [Google Scholar]
- J.-P. Carlier, N. Burlion, Transp Porous Med 86, 87 (2011) [CrossRef] [Google Scholar]
- M.A. Oliveira et al., J. Adv. Concrete Technol. 13, 214 (2015) [CrossRef] [Google Scholar]
For simplicity we didn't include the surface ratio (Av/Al) and lentgh ratio (lv/ll) in the equivalent resistance.
Cite this article as: Xiaoyan Ma, Rachid Bennacer, Farid Benboudjema, and Longfei Chen, Estimation of the drying process in porous media using the parallel and series moitrue transfer model, Eur. Phys. J. Appl. Phys. 98, 49 (2023)
All Tables
All Figures
|
Fig. 1 The climate chamber used in drying, the prismatic porous media (concrete) with embedded sensor [35]. |
| In the text | |
|
Fig. 2 Experimental and numerical results of mass loss (a) and relative humidity evolution (b). |
| In the text | |
|
Fig. 3 Schematic diagram of moisture (vapor) and water (liquid) transfer in different topologies, in parallel (a), series (b) and the combination of the two (c). |
| In the text | |
|
Fig. 4 The diffusion coefficient terms (Dc, Kc), and the equivalent term (Deq) as function of RH in parallel approach (a) and parallel-series approach (different interpolations) (b); for Exp. BC 24 °C, 45%RH. |
| In the text | |
|
Fig. 5 Effect of parallel/series ratio on simulated ML (mass loss) (a) and RH (relative humidity) (b); for Exp. BC 24°C, 45%RH. |
| In the text | |
|
Fig. 6 Uniformed mass loss a) and relative humidity b) with different interpolation values. |
| In the text | |
|
Fig. 7 Contribution terms (Dc, Kc) in equivalent diffusion coefficient (Deq) function of RH, Parallel approach (a) and Parallel-Serie approach (different interpolations) for 38 °C, 32%RH. |
| In the text | |
|
Fig. 8 Simulation results of mass loss (a) and relative humidity (insert of Deq function of RH) (b) with different interpolation for the case Kc ∼ Dc. |
| In the text | |
|
Fig. 9 Comparison of equivalent diffusion coefficient in both boundary condition cases. |
| In the text | |
Current usage metrics show cumulative count of Article Views (full-text article views including HTML views, PDF and ePub downloads, according to the available data) and Abstracts Views on Vision4Press platform.
Data correspond to usage on the plateform after 2015. The current usage metrics is available 48-96 hours after online publication and is updated daily on week days.
Initial download of the metrics may take a while.