Fig. 38
Download original image
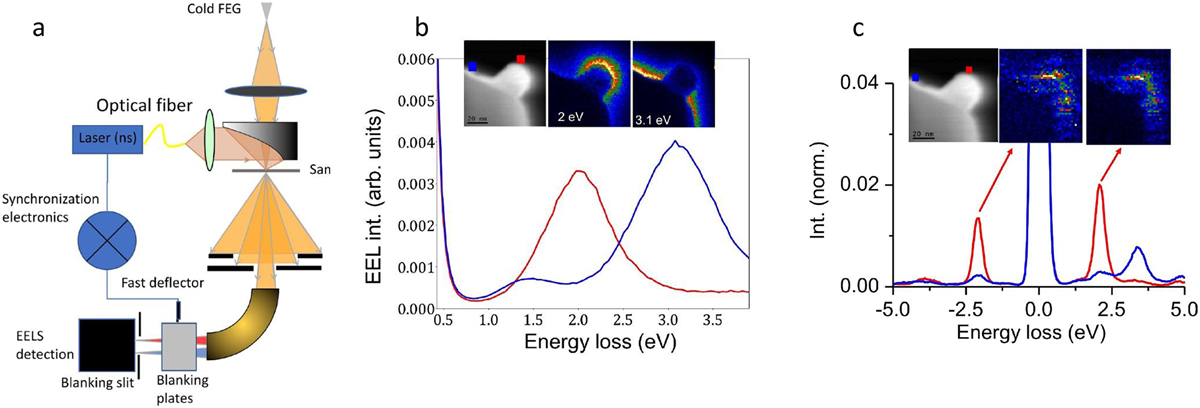
(a): Experimental set-up for the study of laser stimulated EELS and EEGS using a fast detection scheme; (b): EELS spectral-imaging with 900 ms ON time. In this configuration, the sample is illuminated, but most of the detected electrons do not undergo any sEELS/sEEGS event. Inset: HAADF image of the structure (coloured squares indicate the position of the beam where the colour-coordinated spectra in the main panel have been acquired) and filtered images for two main modes. (c): sEELS/sEEGS spectral-imaging with shorter ON time. Specifically, the ON time is close to the laser pulse duration, leading to a clear observation of sEELS/sEEGS features. Inset: HAADF image of the structure (coloured squares indicate the position of the beam where the colour-coordinated spectra in the main panel have been acquired) and filtered images around the energies of the sEELS/sEEGS first peak (courtesy Y. Auad et al. [171]).
Current usage metrics show cumulative count of Article Views (full-text article views including HTML views, PDF and ePub downloads, according to the available data) and Abstracts Views on Vision4Press platform.
Data correspond to usage on the plateform after 2015. The current usage metrics is available 48-96 hours after online publication and is updated daily on week days.
Initial download of the metrics may take a while.