Fig. 34
Download original image
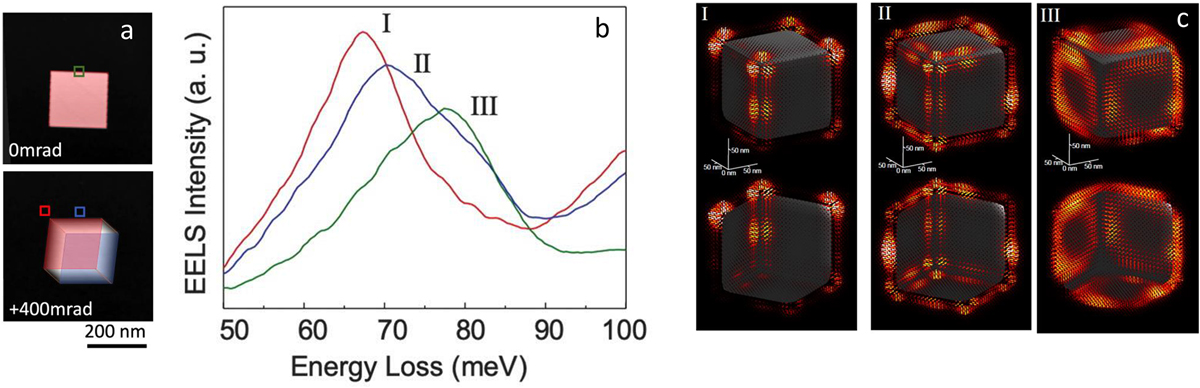
Tomographic surface phonon EELS experiments and reconstruction: (a) HADF images, plane view and tilted view by 400 mrad, of a MgO nanocube of 190 nm edge length; (b) selected spectra recorded at positions indicated in (a) exhibiting maxima fespectively at 68, 69 and 78 meV; (c) 3D vectorial reconstruction of the EMLDOS emphasizing the corner, edge and face localization of the modes I, II and III, the needles indicate the direction of the polarization while the colors indicate the intensity, from red to yellow (courtesy X. Li et al. [153]).
Current usage metrics show cumulative count of Article Views (full-text article views including HTML views, PDF and ePub downloads, according to the available data) and Abstracts Views on Vision4Press platform.
Data correspond to usage on the plateform after 2015. The current usage metrics is available 48-96 hours after online publication and is updated daily on week days.
Initial download of the metrics may take a while.