Fig. 33
Download original image
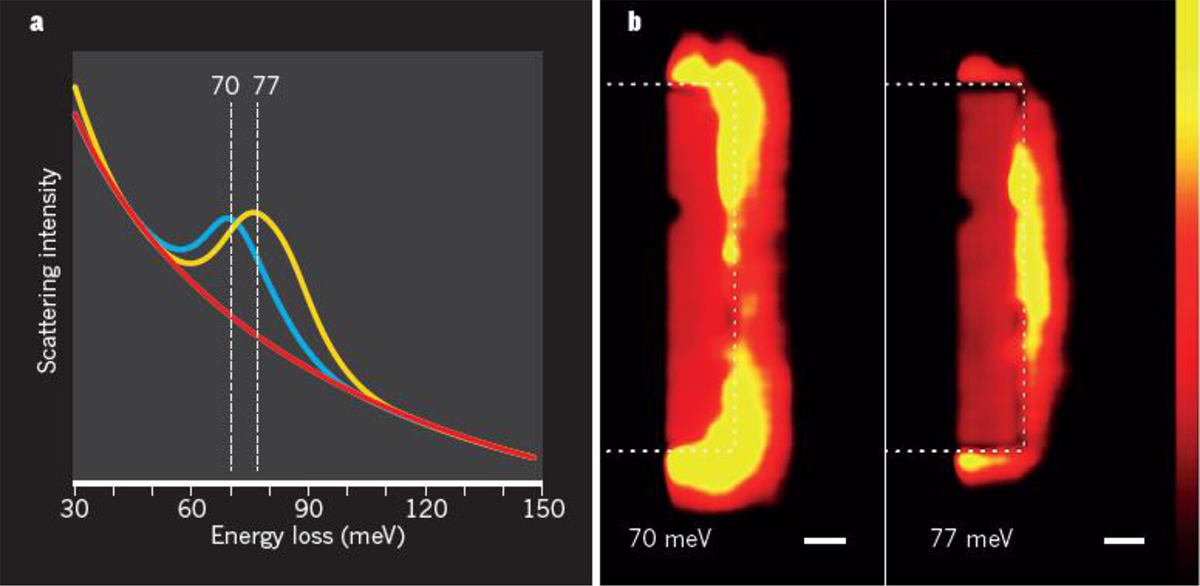
EELS mapping of vibrational excitations in a MgO nanocube of side length 100 nm : (a) spectra produced when the beam is located at a corner (blue), close to a face (yellow), in nearby vacuum (red); (b) maps for energy losses of 70 and 77 meV respectively confirming their corner and face localization (from Lagos et al. [151]).
Current usage metrics show cumulative count of Article Views (full-text article views including HTML views, PDF and ePub downloads, according to the available data) and Abstracts Views on Vision4Press platform.
Data correspond to usage on the plateform after 2015. The current usage metrics is available 48-96 hours after online publication and is updated daily on week days.
Initial download of the metrics may take a while.