Fig. 32
Download original image
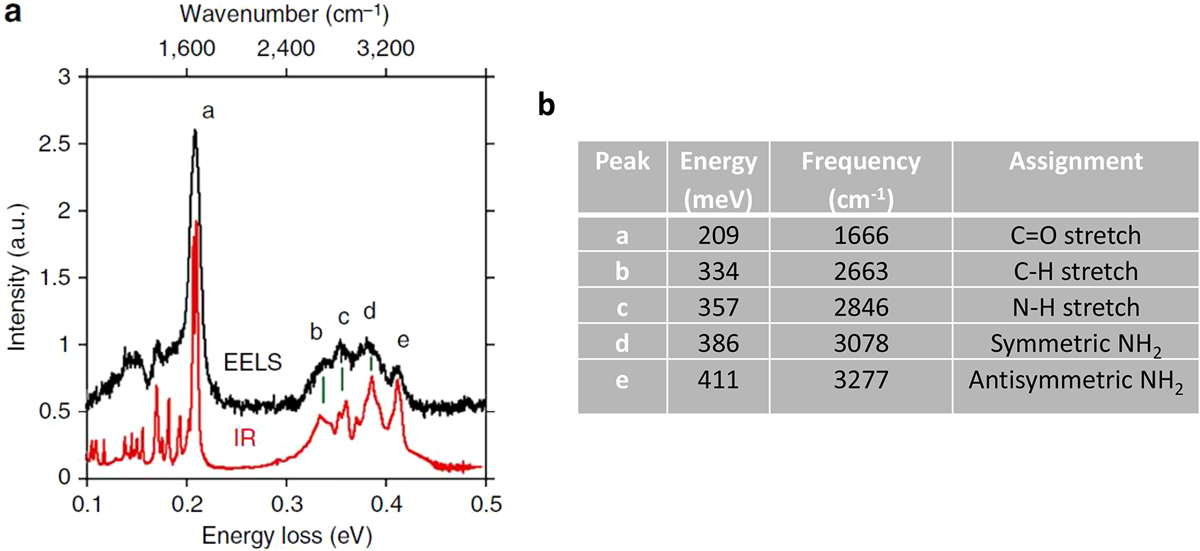
Comparison of aloof EELS and FTIR in the infra-red region on anhydrous guanine crystal (a), EELS : the probe is positioned 30 nm off the guanine edge; FTIR ex situ; (b) : peaks corresponding to C=O, C-H, N-H, NH2 symmetric and NH2 antisymmetric stretches can be seen in the EELS spectrum, matching corresponding features in the FTIR spectrum (from Rez et al. [144]).
Current usage metrics show cumulative count of Article Views (full-text article views including HTML views, PDF and ePub downloads, according to the available data) and Abstracts Views on Vision4Press platform.
Data correspond to usage on the plateform after 2015. The current usage metrics is available 48-96 hours after online publication and is updated daily on week days.
Initial download of the metrics may take a while.