Fig. 30
Download original image
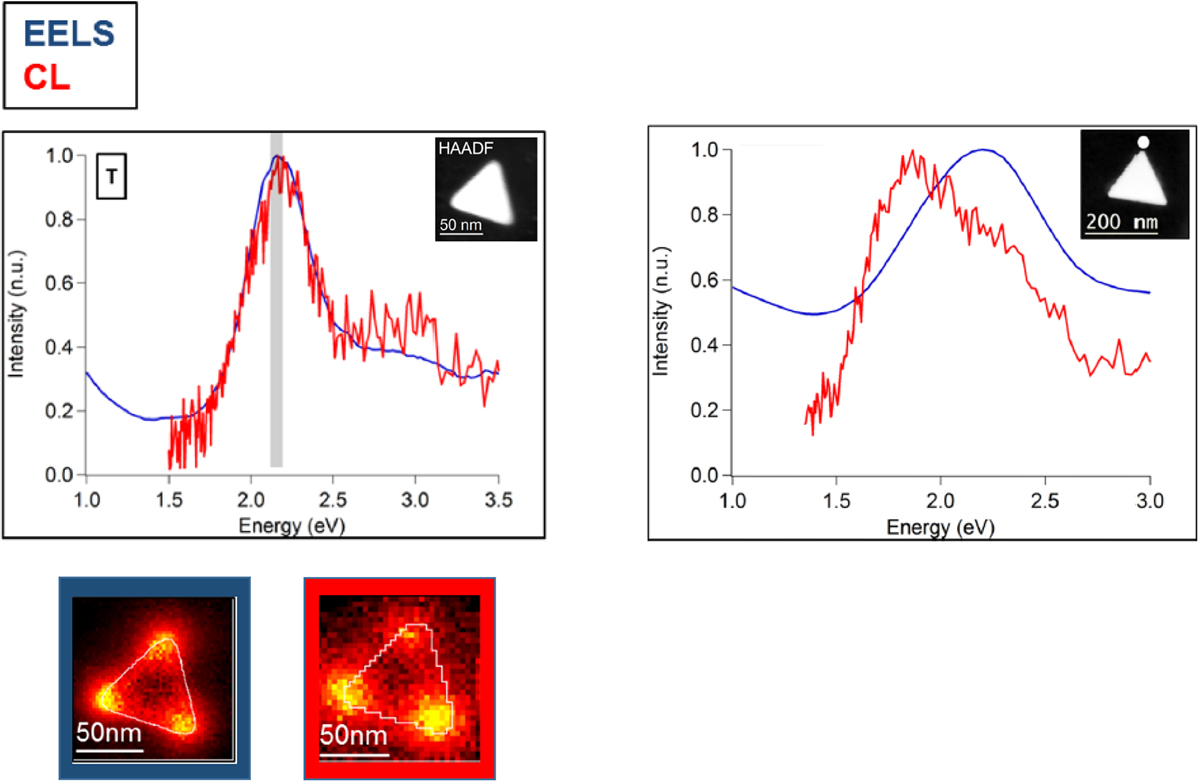
Left : EELS (solid blue line) and CL (solid red line) spectra recorded at the tip of a single gold triangular nanoprism (60 nm side length) using a STEM. EELS and CL maps of the intensity of the resonance peak in the spectra are shown respectively inserted in blue and red frames. (Right) : for the larger particle (140 nm side length), the CL resonance is shifted compared to the EELS resonance, showing that the dipolar plasmon mode resonates at different energies in CL and EELS (reproduced and adapted from Losquin Ph.D. thesis Orsay (2013) and [132]).
Current usage metrics show cumulative count of Article Views (full-text article views including HTML views, PDF and ePub downloads, according to the available data) and Abstracts Views on Vision4Press platform.
Data correspond to usage on the plateform after 2015. The current usage metrics is available 48-96 hours after online publication and is updated daily on week days.
Initial download of the metrics may take a while.