Fig. 27
Download original image
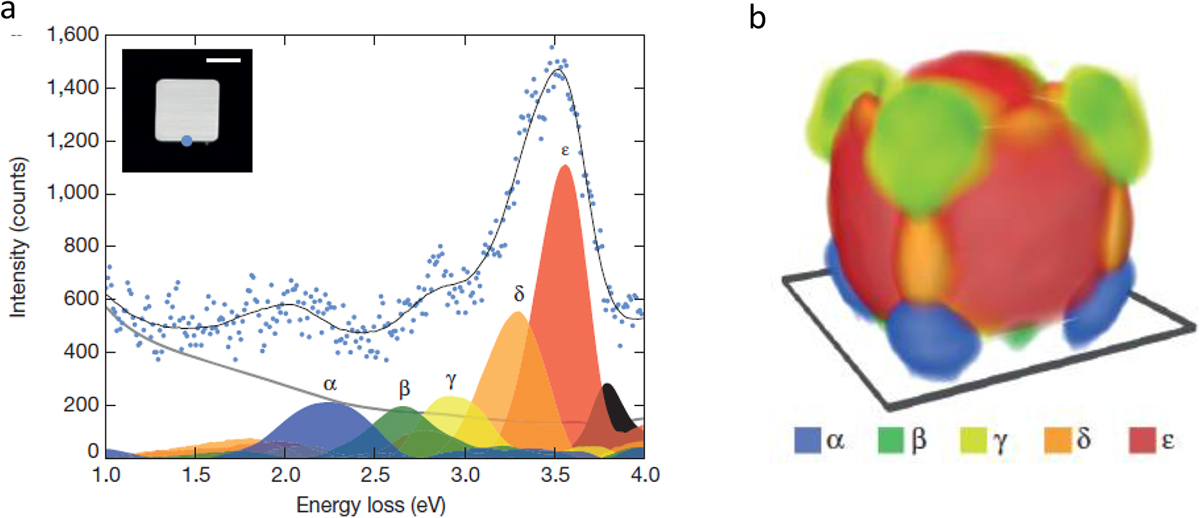
3D-EELS tomographic mapping of the localized surface plasmon resonances (LSPR) on a 100 nm silver nanocube deposited on a 30 nm thick silicon nitride substrate: (a) EELS spectrum recorded for the probe position marked in blue on the HADF image and identification of the spectral components (α, β, γ, δ, and ε) to be attributed to LSPRs on the cube, also visible are the zero-loss tail and the bulk silver plasmon (in black); (b) the reconstructed 3D map of the identified specific components (from Nicoletti et al. [121]).
Current usage metrics show cumulative count of Article Views (full-text article views including HTML views, PDF and ePub downloads, according to the available data) and Abstracts Views on Vision4Press platform.
Data correspond to usage on the plateform after 2015. The current usage metrics is available 48-96 hours after online publication and is updated daily on week days.
Initial download of the metrics may take a while.