Fig. 14
Download original image
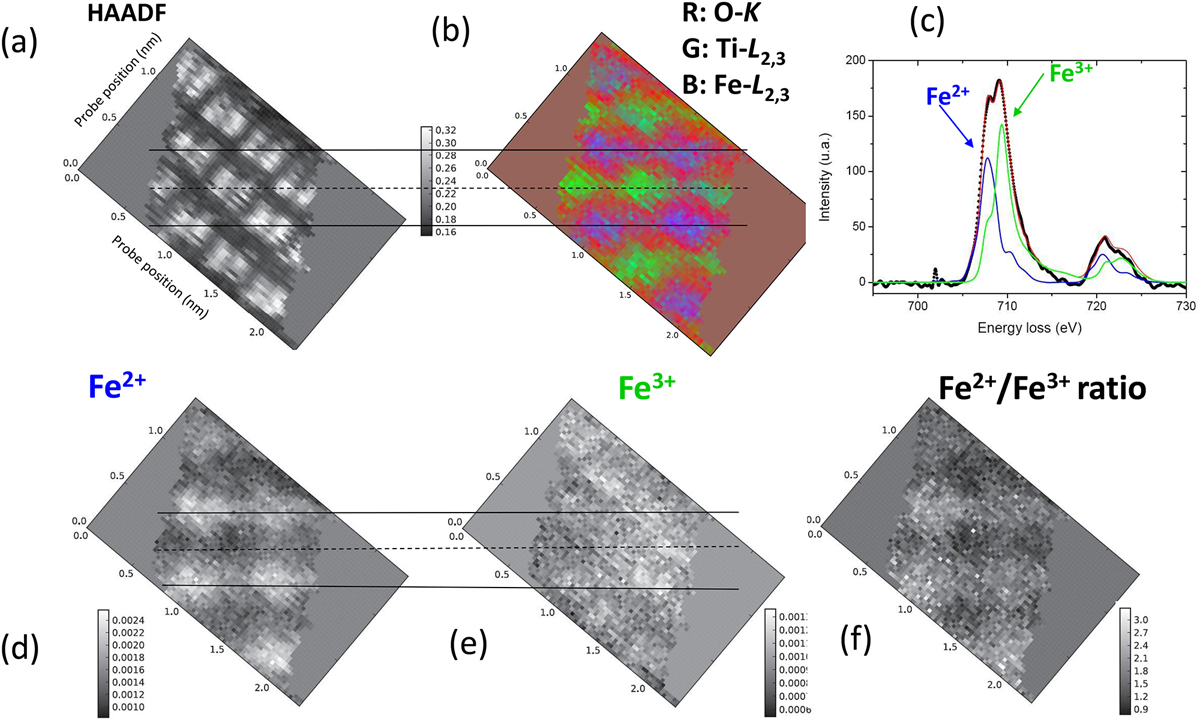
Mapping the valence state distribution down to the atomic resolution in a ferrimagnetic hematite-ilmenite thin film : (a) HAADF image showing the position of the metallic atomic columns; (b) elemental map in false colors showing the position of the O atoms in red, of the Fe atoms in blue and of the Ti atoms in green; (c) EELS spectrum of the Fe L23 line in black on one metallic column displaying the presence of both Fe2+ and Fe3+ as it is made of the addition of both their signature with the corresponding weighted siderite (Fe2+) and hematite (Fe3+) signature; (d to f) Fe2+, Fe3+ and Fe2+/Fe3+ maps illustrating the charge order (from [73], courtesy Laura Bocher).
Current usage metrics show cumulative count of Article Views (full-text article views including HTML views, PDF and ePub downloads, according to the available data) and Abstracts Views on Vision4Press platform.
Data correspond to usage on the plateform after 2015. The current usage metrics is available 48-96 hours after online publication and is updated daily on week days.
Initial download of the metrics may take a while.