Fig. 13
Download original image
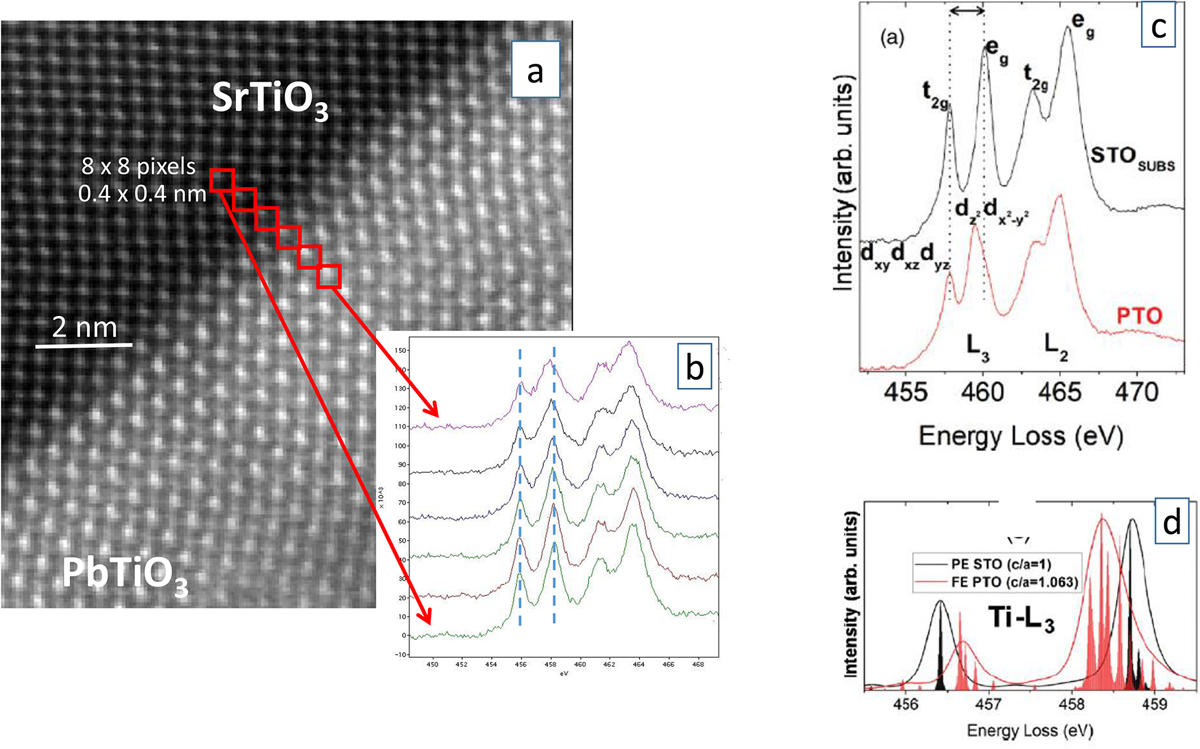
Evolution of the Ti L23 edge across an atomically resolved SrTiO3(STO)/PbTiO3(PTO) interface (a) HADF image; (b) selection of six EELS spectra of the Ti L23 edge, each one built as the addition of 8 × 8 individual spectra recorded over the red squares shown in (a) [65]; (c) reference spectra recorded on larger areas of STO (black) and PTO (red); (d) ab initio and multiplet calculations of the L lines profiles demonstrating a reduced t2g-eg splitting of the L3 line from the cubic STO cell to the tetragonally distorted PTO cell [70].
Current usage metrics show cumulative count of Article Views (full-text article views including HTML views, PDF and ePub downloads, according to the available data) and Abstracts Views on Vision4Press platform.
Data correspond to usage on the plateform after 2015. The current usage metrics is available 48-96 hours after online publication and is updated daily on week days.
Initial download of the metrics may take a while.