Fig. 1
Download original image
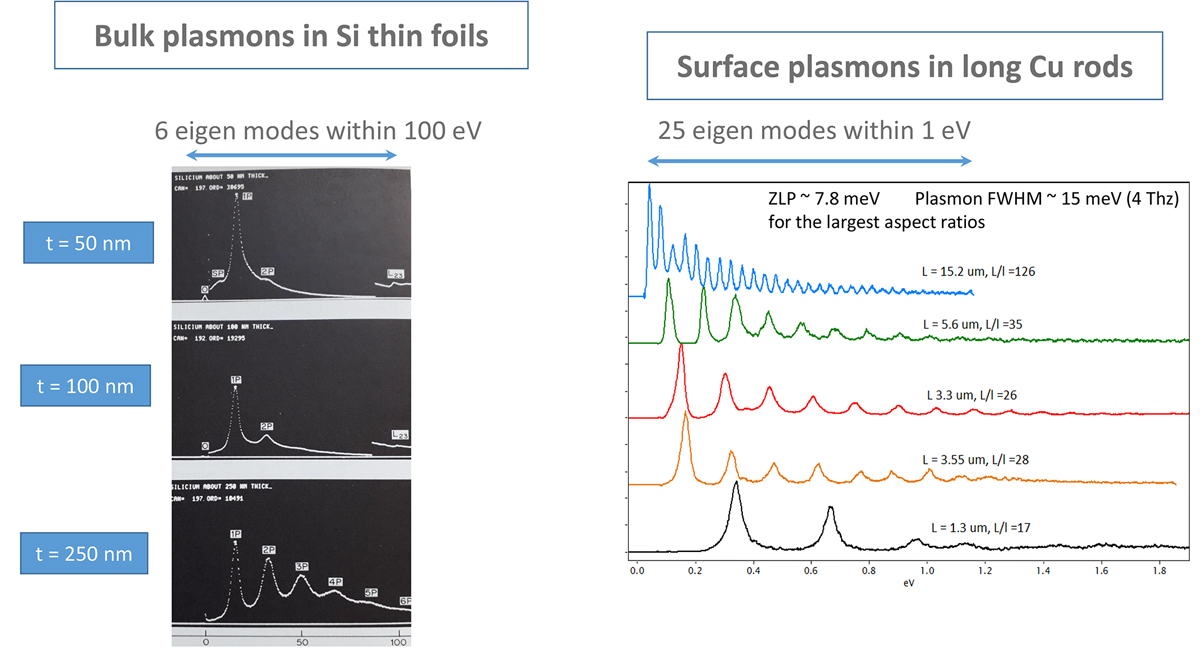
EELS spectra displaying on the left the excitation of bulk plasmons in Si as recorded in the seventies (published in Colliex [17a]) and on the right the excitation of surface plasmons on long Cu nanorods as recorded very recently with a STEM of the latest generation (courtesy A. Gloter and X. Li, private communication, 2019).
Current usage metrics show cumulative count of Article Views (full-text article views including HTML views, PDF and ePub downloads, according to the available data) and Abstracts Views on Vision4Press platform.
Data correspond to usage on the plateform after 2015. The current usage metrics is available 48-96 hours after online publication and is updated daily on week days.
Initial download of the metrics may take a while.