Open Access
Fig. 2
Download original image
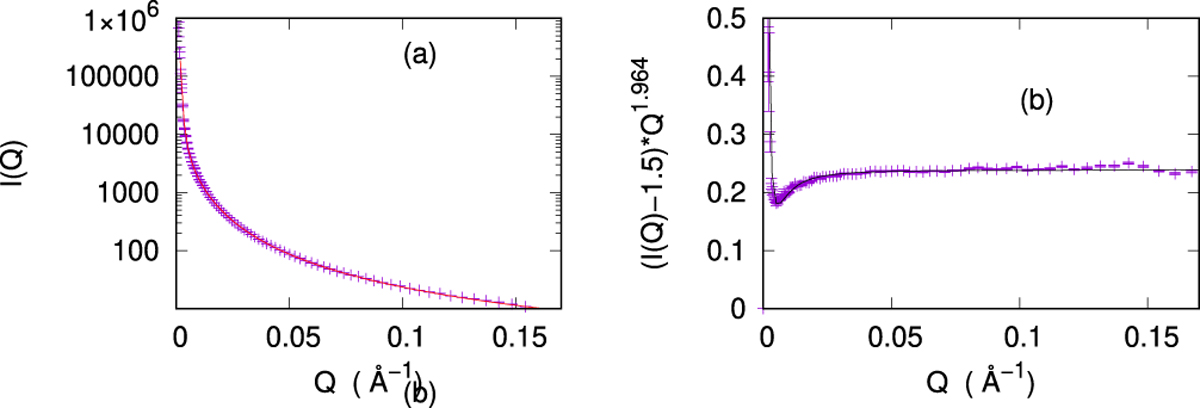
(a) Plot of the observed intensity after circular averaging of the pattern of Figure 1. The fit to equation (8) is shown (red line) (b) same plot after subtacting 1.5 and rescaling by Q1.964, demonstrating the critical scattering.
Current usage metrics show cumulative count of Article Views (full-text article views including HTML views, PDF and ePub downloads, according to the available data) and Abstracts Views on Vision4Press platform.
Data correspond to usage on the plateform after 2015. The current usage metrics is available 48-96 hours after online publication and is updated daily on week days.
Initial download of the metrics may take a while.