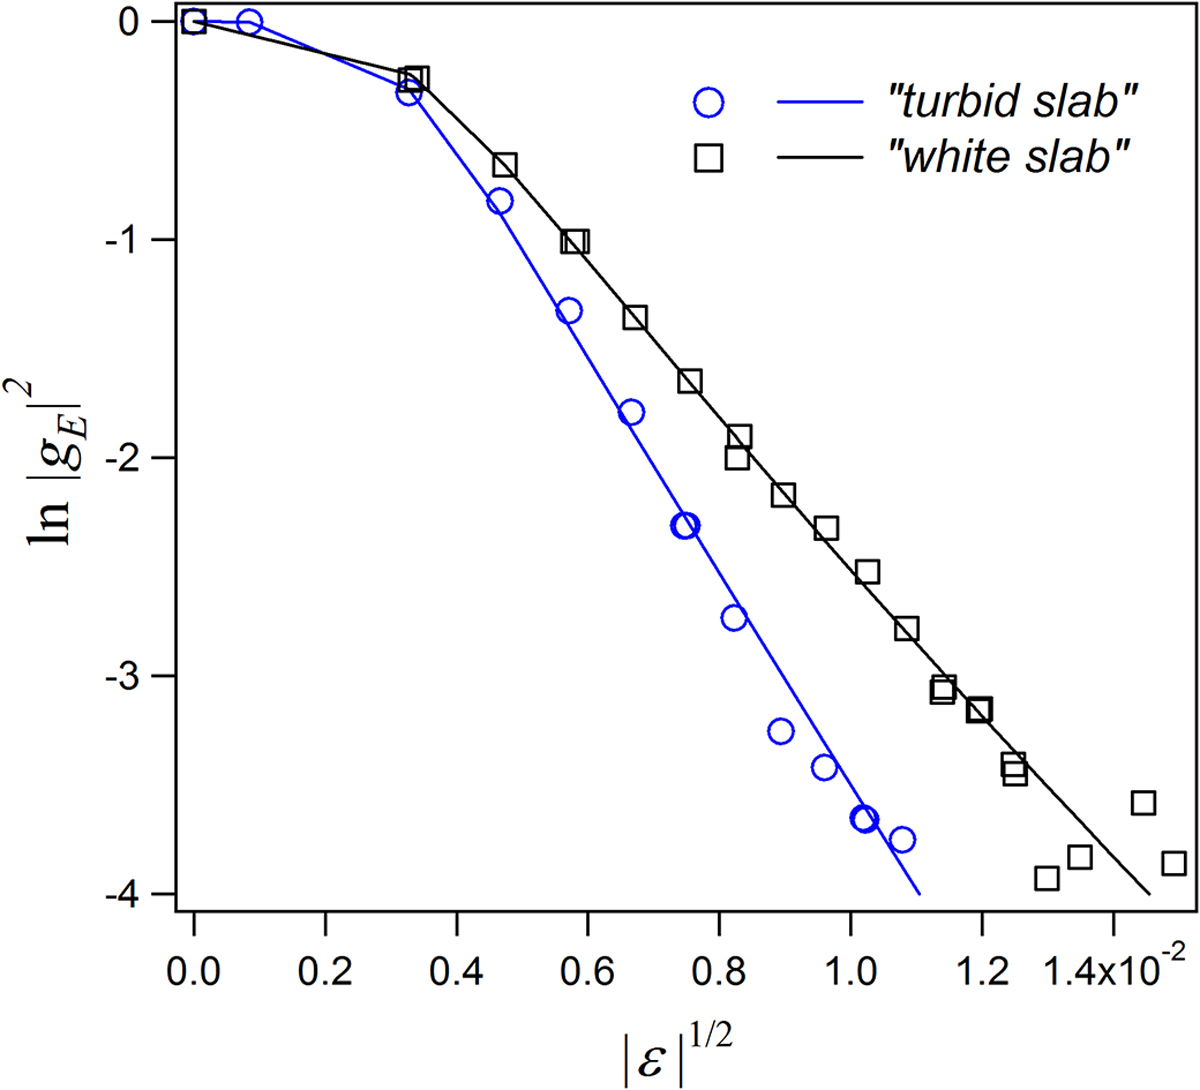
Fig. 3
Download original image
Decorrelation of the scattered intensity with the wavelength modulation of the incident light for the samples of TiO2 particles embedded in PDMS matrix. Symbols stand for the experimental points and the lines correspond to the fitting curves obtained from equation (8): blue circles − “turbid slab”, black squares − “white slab”.
Current usage metrics show cumulative count of Article Views (full-text article views including HTML views, PDF and ePub downloads, according to the available data) and Abstracts Views on Vision4Press platform.
Data correspond to usage on the plateform after 2015. The current usage metrics is available 48-96 hours after online publication and is updated daily on week days.
Initial download of the metrics may take a while.