| Issue |
Eur. Phys. J. Appl. Phys.
Volume 82, Number 2, May 2018
|
|
|---|---|---|
| Article Number | 20801 | |
| Number of page(s) | 18 | |
| Section | Plasma, Discharges and Processes | |
| DOI | https://doi.org/10.1051/epjap/2018180074 | |
| Published online | 15 August 2018 | |
https://doi.org/10.1051/epjap/2018180074
Regular Article
Ignition and advancement of surface discharges at atmospheric air under positive lightning impulse voltage depending on perpendicular electric stress and solid dielectrics: modelling of the propagating phenomenology
1
Sicame Group S.A., Laboratoires LABEP,
Avenue Basile Lachaud B.P. 1,
19230
Arnac-Pompadour, France
2
University of Lyon I, École Centrale de Lyon, Laboratoire Ampère CNRS UMR 5005,
36 Avenue Guy de Collongue,
69130
Ecully, France
* e-mail: This email address is being protected from spambots. You need JavaScript enabled to view it.
Received:
23
February
2018
Received in final form:
1
May
2018
Accepted:
25
May
2018
Published online: 15 August 2018
Abstract
In many high voltage equipment, partial discharges are regarded as one of the most widespread pathology whose ignition conditions and effects are studied by scientists and manufacturers to avoid major failures. Actually, those electrical gaseous phenomena generally occur under several constraints such as the electrostatic field level, the nature of insulating surface being polluted or not, and switching or lightning transients. The present paper discusses physical mechanisms related to the creeping discharges propagation growing over insulators subjected to perpendicular electric field and positive lightning impulse voltage. More precisely, the developed discussion attempts to answer some observations especially noticed for main discharges feature namely (i) the discharges morphology, (ii) their velocity and (iii) the space charges effects on electric field computation. Several factors like (i) the influence of the type of a material’s interface, its electric conductivity, permittivity and discharges mobility, (ii) the relationship between the applied electrostatic field, the space charges, the velocity, the propelling pressure and discharges temperature are among numerous parameters that have been addressed in this study which discusses lightning impulse transients phenomena.
© EDP Sciences, 2018
1 Introduction
Electrical discharges plasma appear as very fast transient phenomena that are known to occur on high voltage equipment and may sometimes induce serious deteriorations [1]. It is widely recognized that discharges are issued from a complex process governed by the Townsend mechanism responsible for their ignition and development depending mainly on the contacting gas properties, the dielectric substrate, the electric field distribution as well as the profile and polarity of applied voltage (Fig. 1) [2]. However, the discharges’ occurrence and propagation are greatly influenced by the presence of space charges which may modify their activity by enhancing or reducing the electric field intensity leading to change the inception voltage value (PDIV), their magnitude or the propagation phenomenology within a dielectric bulk or on its surface [3,4]. Consequently, one of the most promising approaches have concerned the correlation of the measured discharges charge (or current) with the rate and type of destructions made to H.V. devices for condition monitoring purposes to check insulation degradations [5].
Actually, the topic of partial discharges has been extensively studied by researchers worldwide by adopting many methods owing to numerous parameters involved in its initiation, development and elongation because of its important impact for the electric network protection and the personal safety of customers. Aydogmus and Cebeci [7] developed a mathematical model based on the field criterion, using the finite element method (FEM), for the flashover prediction on polluted insulators under service conditions and found out a good agreement between their results and others available in literature. Albano et al. [8] combined clean fog artificial testing and infrared recordings with the leakage current measurement on silicone rubber (SiR) insulators to provide new possibilities for the modeling of dry-band discharges. Their thermal results allowed to discriminate and to quantify more accurately the convective and evaporation heat losses associated with the power dissipation. Crespo-Sandoval et al. [9] focused on tracking and erosion tests on SiR insulators by calculating various parameters (FFT, THD, energy and power factor) to be used as possible indicators of the materials’ failure. They found out that the derived rate of energy absorption may be used as a quantitative indicator of degradation level of sample. Rowland et al. [10] have used many imaging techniques such as X-ray Tomography and serial block face scanning electron microscopy (SBFSEM) to provide a detailed 3-D reconstruction of electrical trees observed in an epoxy block and used the FEM technique for the determination of the electric field distribution. They evidenced that the tree growth geometry and its spatial distribution depend drastically on the local electric field value at the head of each branch (i) that influence its propagation direction and orientation and (ii) whose channel radius increases as the electric field value decreases. Mauseth et al. [11] and Chen et al. [12] investigated the initiation and growth of electrical trees in XLPE insulation subjected to different types of electrical stresses for quality assurance aims using SEM observations and experimental data. They revealed that (i) the growth rate of electrical trees is enhanced by increasing the voltage level and the frequency value, (ii) the tree growth at 50 Hz is more rounded off and bush shaped than the longer trees with fewer branches generated at lower frequencies, and (iii) the weakest discharges activity during the tree propagation does not allow the tree to develop forward. Nevertheless, it may be the main reason for the constitution of carbonized degradation byproducts leading to suppress the partial discharges activity. Shakti Prasad and Subba Reddy [13] used the image processing technique to observe the corona plasma phenomenon based on various parameters like average intensity, area of the spread, energy, entropy and luminosity content in the processed image. Their results concluded on the suitable use of those factors to estimate the degradation rate induced on insulating materials as well as the electrical power consumption due to corona discharges. Pancheshnyi [14] analyzed quantitatively the photo-ionization mechanism occurring by radiation emitted in low current discharges in different pure gas media namely O2, N2, CO2 and air. Regarding unitary gases with low admixtures of other gases, Pancheshnyi found out that the ionizing radiation is generated in one impact by direct dissociative and ionizing excitation reaction. While in O2–N2 mixtures, photoionization occurs via ionization of O2 molecules due to the absorption of the emission by excited N2 molecules. Farokhi et al. [15] investigated the effect of dc polarity on electrical and optical properties of discharges on a surface of ice. They concluded that (i) many difference in the structure of DC-positive and DC-negative discharges exist as a result of the space charges generation, and (ii) the corona discharges emitted a low-light-intensity envelope around the arc root especially for the DC-positive polarity.
However, extensive studies have focused on AC or DC voltage polarities effects in oil or gas media for explaining discharges propagation mechanisms to the final flashover but only few of them were interested in describing the discharges phenomenon that occur in air under the lightning impulse voltage [16–19].
In this paper, effects of lightning impulse voltage under positive polarity on the propagation of creeping discharges over various solid dielectrics are analyzed. As described in previous publications [20,21], the main concerns were about (i) de-noising some data such as current, voltage and captured images at first [20], and then moving to (ii) modeling and calculation of discharges parameters using different mathematical formulations for more accuracy [21]. In this survey study, an attempt to explain various physical phenomena, observation and results obtained during experiments (namely the discharges morphology, the velocity and then the space charges influence) is presented as an overview of the discharges growth mechanism in air, depending on the used polymeric interface, and to identify the mutual interaction that exists between discharges and assessed plastics.
 |
Fig. 1 Descriptive diagram of the electrical breakdown process occurring in air over an insulator surface through the Townsend mechanism [6]. |
2 Test setup
The experimental test setup is similar to that used by our group for laboratory investigations [22]. The test cell contains needle–plane electrodes with a needle perpendicular to the insulating material surface. The leakage distance between electrodes equals Ld = 43 mm and the air gap between the H.V. needle and the insulating material equals d = 2 mm. The needle electrode was made of stainless steel and its radius of curvature, rp, is equal to 11.4 µm. This latter is checked under a microscope and changed each time a critical value of its radius of curvature (rc = 15 μm) is exceeded.
The tested materials belong to three distinguishable polymeric families [20,21]: (1) thermoplastics (namely polyamide 6 filled with 50 wt.% of glass fibers (noticed as PA6/50, Fig. 2a) and polyamide 66 filled with 50 wt.% of glass fibers (noticed as PA66/50, Fig. 2a); (2) one EPDM elastomer (noticed as EPDM, Fig. 2b); and (3) one thermosetting cycloaliphatic epoxy resin filled with 66 wt.% of silica flour (noticed as FCEP, Fig. 2c).
 |
Fig. 2 Chemical functional groups of investigated materials, (a) polyamides (PA6/50 and PA66/50), (b) cycloaliphatic epoxy resin (FCEP) and (c) EPDM elastomer. |
3 Results and discussion
In this section, both effects and variation of physical parameters related to the discharges propagation are analyzed to identify properly their governing mechanisms for each tested polymer. These discharges’ factors may be listed as: morphology (radius and volume), energy, velocity and its influencing parameters (energy fraction (Ω), temperature (T) and air density (ρ)), electric surface conductivity, permittivity, space charges and charged particles motion.
3.1 Discharges morphology
Previous investigations demonstrated that discharges extensions as well as their brightness are well correlated with the voltage enhancement and the type of used barrier incorporated between electrodes [21]. It has been also shown that both discharges’ brightness and thickness depend on the crest value applied to the material and on the chosen polarity (being positive or negative). Furthermore, the computation of the average discharges radius and volume is provided to define accurately their geometrical shapes and propagating characteristics.
To do so, the discharges radius (r+(t)) is calculated based on the Wilkins model as given below [23]:
 (1)
(1)
Then, the average discharges radius (ra) is computed according to expression (2):
 (2)
where N is the number of sampling data. Finally, by supposing that (i) the discharges propagation shape is similar to a cylinder in motion of a fixed radius value ra and, (ii) the distribution of electric charges is uniform along the cross section of the plasma channel [24], the average volume (Vd) is assessed by expression (3):
(2)
where N is the number of sampling data. Finally, by supposing that (i) the discharges propagation shape is similar to a cylinder in motion of a fixed radius value ra and, (ii) the distribution of electric charges is uniform along the cross section of the plasma channel [24], the average volume (Vd) is assessed by expression (3):
 (3)where Lf (in mm) is the final length of discharges measured according to [21]; Vd is expressed in mm3. Figure 3 depicts effects of the type of a material and the field gradient level on both average discharges’ radius (Fig. 3a) and volume (Fig. 3b). It is shown that increasing the voltage gradient increases significantly the discharges radius for both polyamides (PA6/50 and PA66/50) while it increases slightly for FCEP and EPDM in a similar way (Fig. 3a) but with a reduced value for EPDM. As the discharges volume is also concerned (Fig. 3b), the applied field gradient influences markedly the discharges volume/density since its elevation induces a remarkable increase of the produced plasma volume especially for polyamides whereas it increases slowly for FCEP and EPDM.
Moreover, a comparison of the discharges volume is provided in Figure 4 and allows distinguishing surface properties of used solids. Indeed, it appears that the plasma volume varies randomly in time having pronounced pulsing shapes for polyamides (namely PA6/50 and PA66/50). Nevertheless, the discharges volume on FCEP and EPDM varies more regularly with a reduced pulsing tendency for FCEP in comparison to EPDM. Note that both average discharges radius and volume reach their highest value at lower voltage levels when using polyamide materials.
Many researchers pointed out that creeping discharges patterns depend strongly on the sample’s permittivity as well as its thickness, the surrounding medium in which it is immersed, the voltage polarity and its crest value [25–31]. It has also been observed that discharges are longer on PA6/50 and PA66/50 surfaces than on FCEP and EPDM ones because of the lowest surface conductivity of FCEP and EPDM (as explained in Sect. 3.4); note that discharges propagate harder on EPDM surface than on FCEP. However, the voltage values needed for discharges ignition is more elevated than those recorded for polyamides. Moreover, flashover occurs for polyamides when the discharges length reaches 60% of the leakage distance while that it ranges from 45% through 50% of the leakage distance for FCEP and EPDM [32]. The increase of discharges radius due to voltage is likely explained by the raise of particles density (electrons, positive and negative ions), constituting the plasma channel and are likely to participate to the discharges channel elongation because of photoionization as reported by Serdyuk et al. [33]. One of the most widely applied computation techniques relies on the use of Helmholtz equations of continuity and radiative transfer principles for the calculation of electrons, positive and negative ions densities. These equations describe the streamer dynamics and are expressed as in the following [34,35]:
 (4)
(4)
 (5)
(5)
 (6)
where t, ne, np and nn are respectively time, the number densities of electrons, positive ions and negative ions. we, wp and wn are respectively the drift velocities of electrons, positive ions and negative ions. α and a are respectively the ionization and net attachment coefficients that take into account 2–3 body attachment of electrons to oxygen molecules. De, βep and βpn are respectively the diffusion coefficient for electrons, the coefficient of electron-ion and ion-ion recombinations respectively. Sph and S0 are respectively the rate of photoionization and appearance of first electrons.
(6)
where t, ne, np and nn are respectively time, the number densities of electrons, positive ions and negative ions. we, wp and wn are respectively the drift velocities of electrons, positive ions and negative ions. α and a are respectively the ionization and net attachment coefficients that take into account 2–3 body attachment of electrons to oxygen molecules. De, βep and βpn are respectively the diffusion coefficient for electrons, the coefficient of electron-ion and ion-ion recombinations respectively. Sph and S0 are respectively the rate of photoionization and appearance of first electrons.
In addition, the above hydrodynamic diffusion-drift (Eqs. (4)–(6)) model is applied in many cases by researchers to study the photo-ionization process within gas volumes as well as its contribution for the plasma channels advancement. This mechanism is a complex physical phenomenon which receives a particular attention by the scientific community and consists of the absorption of electromagnetic radiation (photons) by an atom in a gas resulting of the release of charged particles. These ionized species join the high electric field region and participate to the enhancement of electrons, positive and negative ions densities through the electrostatic force by guiding the particles fluid dynamic and enlarging discharges lengths [33].
According to Loeb [36], Dyakonov and Kachorovskii [37], the process of ionization including the streamer’s forehead tip is the most dominant one occurring very quickly in comparison to the Maxwelian relaxation rate. It comes out that the ionized domain is quietly converted into a dielectric relaxation one. This mechanism is believed to take place for polyamide materials (PA6/50 and PA66/50) explaining their higher radii values as well as their volume dimensions.
As concerns FCEP and EPDM, the small values registered for discharges are believed to be driven by the Dawson and Winn mechanism which is likely thought to govern the main discharges propagation process [38]. This process includes a slow movement of avalanche drift toward the streamer’s forehead and imposes a limitation to their velocity values as demonstrated in [21]. As a result, the streamer advancement happens because of the photo-ionization mechanism generated within a narrow layer ahead of the streamer tip but without involving the avalanches drift.
 |
Fig. 3 Influence of the type of a material interface and the applied field gradient on (a) the average discharges’ radius and (b) the average volume. |
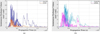 |
Fig. 4 Temporal distribution of the average discharges volume at Ucrest = 27 kV for (a) PA6/50 versus FCEP and (b) PA66/50 versus EPDM. |
3.2 Power and energy of discharges
When initiated on a dielectric, discharges generally need to be fed with an electric power quantity to be driven along the polymer surface. Consequently, the energy gained by the plasma channel during its propagation will influence the degradations rate depending on the temperature’s plasma and its dimensions. To do so, the instantaneous electric power (P(t)), the average power (<P>) as well as energy (E) of creeping discharges are computed according to the following expressions:
 (7)
(7)
 (8)
(8)
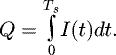
 (9)
where U(t), I(t) and Ts are respectively the applied voltage, the impulse current and the period. Regarding the electric power consumption (Fig. 5a), polyamides allow providing to discharges higher amounts of power at lower voltage values, especially for PA66/50. As FCEP and EPDM are also concerned, the discharges power remains below that of polyamides but is slightly enhanced when increasing the field gradient value; note that elevated power values are recorded for FCEP in comparison to EPDM. In Figure 5b, the discharges energy is the highest for both polyamides (PA6/50 and PA66/50) whereas that depicted by FCEP and EPDM is the lowest and requires elevated field gradient levels. However, energy values recorded for all materials remains undoubtedly lower to induce serious damages to solids as discussed in [39]. Nevertheless, it remains sufficiently higher for the particles photo-ionization process [40].
(9)
where U(t), I(t) and Ts are respectively the applied voltage, the impulse current and the period. Regarding the electric power consumption (Fig. 5a), polyamides allow providing to discharges higher amounts of power at lower voltage values, especially for PA66/50. As FCEP and EPDM are also concerned, the discharges power remains below that of polyamides but is slightly enhanced when increasing the field gradient value; note that elevated power values are recorded for FCEP in comparison to EPDM. In Figure 5b, the discharges energy is the highest for both polyamides (PA6/50 and PA66/50) whereas that depicted by FCEP and EPDM is the lowest and requires elevated field gradient levels. However, energy values recorded for all materials remains undoubtedly lower to induce serious damages to solids as discussed in [39]. Nevertheless, it remains sufficiently higher for the particles photo-ionization process [40].
Furthermore, Figure 6 illustrates the temporal distribution of discharges energy during their propagation. A severe pulsing trend is noticed for polyamides with significant peak values especially for PA6/50 (Fig. 6a) while the activity of energy remains more regular in the case of FCEP and EPDM without pulsating peaks (Fig. 6b).
Many scientists pointed out that the streamer inception and propagation stages are both issued from the electrostatic energy which accumulates in the electrodes-dielectric system. Note that the spatial distribution of the electric field is completely used for the streamer build-up steps. Then, as this energy is mainly located in the plasma forehead and dissipated during elastic collisions due to excitation, ionization, radiation and joule dissipation phenomena [41]. More accurately, this amount of energy contributes to the creation of an electrified envelope around the streamer in which space charges are uniformly distributed along the plasma channel. Note also that this energy increases exponentially as the power supply level increases [42].
Moreover, a streamer may be defined as an ionizing and oscillating electromagnetic wave which propagates oppositely to the electrons drift. It is driven by many factors namely: gas pressure and mixtures, applied voltage level and polarity, electrodes distance and related used raw materials [43,44]. In the one-and-half model [45], Aleksandrov and Bazalyan made the proposal of a secondary emission wave for non-uniform field configurations and long air gaps. In the presence of optimal conditions, positive streamers appear in a gas or liquid medium as bright filaments growing up to the cathode. Consequently, as the growth of streamers is theoretically dominated by at least 2 body collisions, approximate geometrical shape similarities of electrical trees could be obtained experimentally at different pressures [46].
In addition, surface flashover (SFOV) resulting of the electronic emission mechanism through space charges generation plays an important role in the development of creeping discharges and depends strongly on the type of used polymer [47–49]. Grzybowski et al. [50] investigated the SFOV mechanism for various materials (namely PMMA, TFE and PE) in vacuum and concluded that the difference in SFOV between polymers is controlled by various factors such as conditioning processes, the electrons emission from the cathode, the charging rate of insulator surface, the desorption of surface gases and subsequent breakdown through these gases. Hegeler et al. [51] consolidated that point of view by stating that flashover is owing to a gaseous ionization process whose rate and motion are strictly linked to the chemical structure of a material undergoing the phenomenon. According to Peek [52], streamers may be decomposed into two distinguishable regions: (i) the streamer head (also named active region) from where the luminous emission and ionization processes take place, and (ii) the streamers channel or passive region where electrons are generated in the tip flow and move forward toward the H.V. electrode by remaining attached to the electronegative molecules. Regarding polyamide materials, generated space charges in the streamer head is remarkable leading to increase the energy gained by emitted electrons (Wg) as well as their velocity throughout the advancement of electronic avalanches resulting of longer streamer channels [53]. Oppositely, the streamer channel propagates at lower velocities with shorter lengths on FCEP and EPDM interfaces, despite of higher applied electric field levels, which is likely due to a lower amount of space charges and an important energy loss by electrons (Wl). This is due to collisions with gas molecules [54] and/or to discharges energy absorption by materials, as shown in Figure 6b. In addition, a basic equation of energy (E), based on Gallimberti and Allen criteria [53,54], could be formulated by including a third term, namely ΔWp, that represents the change in potential energy and resulting of the creation of each new streamer head as shown by (10):
 (10)
(10)
In most cases, the particles collision are generally induced by ionization, attachment, excitation, dissociation and recombination mechanisms yielding the energy (Wg) no longer sufficient for FCEP and EPDM materials. This is likely due to the particles attachment with the material atoms leading to probably raise the energy (Wl) and results of stopping the discharges propagation despite of higher applied field gradients [55]:


In the presence of optimal conditions, positive streamers appear in a gas or liquid medium as bright filaments growing up to the cathode. As the growth of streamers is theoretically dominated by at least 2 body collisions, approximate geometrical shape similarities of electrical trees could be obtained experimentally at different pressures [56]. On the other hand, the computation of radical components issued from gas decomposition in atmospheric air due to positive streamers, using a sphere-plane electrodes configuration, have been also achieved through a 2D numerical model, as developed by Naidis [57]. It includes the balance equations for concentration of charged particles and the equation for potential of electric field. Regarding the dissociation reaction, the generation of nitrogen atoms is produced as indicated above:
Then, the full excitation process of nitrogen atoms is induced as described in the following:

Finally the subsequent reaction regarding air dissociation when electric plasma appears is described by the following chemical reaction:
Consequently, it is evidenced that N2 and O2 molecules produce atoms as well as chemical components mainly located in regions where the electric field is reinforced, such as in the streamer forehead where hot electrons are available. Their ignition rates depend also on discharges propagation conditions namely: applied voltage level and its duration, polarity and electrodes gap distance [56,57]. The pulsed positive corona discharges are actively studied due to their significant role for gas cleaning from toxic chemical by-products such as CO2 and NOx [58]. This kind of discharges has a structure of a number of streamers-thin plasma channels that propagates within an electrodes gap.
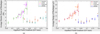 |
Fig. 5 Effects of the type of a material and the value of field gradient on (a) average electric power and (b) average energy of discharges. |
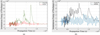 |
Fig. 6 Temporal distribution of the discharges energy at Ucrest = 27 kV for (a) PA6/50 versus FCEP and (b) PA66/50 versus EPDM. |
3.3 Discharges velocity and its influencing factors
According to previous works [20,21], the computation of the discharges velocity using different theoretical approaches evidenced some differences with empirical values. Indeed, the discharges velocity computed with equation (12) exhibits different values than those calculated with the expression provided by Les Renardières Group [21]. It is mainly due to the influence of two parameters namely (i) the air density (ρ), and (ii) the fraction of available energy (Ω). For the former, its value is constant during the discharges propagation and for the latter its value is also fixed equal to 0.1. According to Figure 7, the influence of energy fraction (Ω, Fig. 7a) for FCEP interface is less pronounced than that of the air density (ρ, Fig. 7b), that is acting oppositely on the discharges velocity. The increase of energy fraction emphasizes the discharge velocity while air density elevation induces a sudden reduction of the velocity (ranging from 0.1 through 0.2 kg/m3) before decreasing slowly until 1 kg/m3.
Moreover, streamer velocities propagating along dielectric surfaces are known to be slightly higher than those for simply discharges bulk gases [59,60]. These higher values of discharges velocities obtained on polyamides (PA6/50, PA66/50) are attributed to the increase of the ionization rate intensity in the presence of insulating surfaces. Furthermore, the difference in velocities between tested materials (PA6/50, PA66/50, FCEP and EPDM) is likely explained by the difference in the photo-emission potential induced on solids. However, the lower velocity value computed for FCEP and EPDM are mainly due to the higher photo-energy threshold required to produce a photo-electron from their surfaces despite of elevated applied electric field [61,62]. Similar conclusions have been drawn for ceramic materials while PTFE behaves oppositely as reported by Chvyreva [63].
As concerns discharges temperature, Xiao et al. [64] showed that under AC voltage the produced temperature value is between 1200 and 1500 K for current values ranging from −4 through 3 mA and for discharges lengths included between 2 and 6 mm. Similar results have been obtained and approximated by the normal distribution (expression (11)) as depicted in Figure 8a [65]. It shows that current values are higher for polyamides in comparison to FCEP and EPDM. Slama [66] demonstrated that, under extreme conditions, the discharges temperature could reach 2000 K for positive LI voltage and varies according to polluting constituents, to the voltage polarity and to the energy fraction value (Ω). Hence, considering that air density is sensitive to temperature as shown by equation (13), it comes out that the velocity value calculated with equation (12) is in turn dependent on the air density variation which should be taken into account for further estimations.
 (11)
where P(I), σ, Ii and Im are respectively the density probability of a sample I, the standard deviation, the value of ith sample and the mean value.
(11)
where P(I), σ, Ii and Im are respectively the density probability of a sample I, the standard deviation, the value of ith sample and the mean value.
 (12)where ρ, Ω, U(t), I(t) and r(t) are respectively air density, fraction of available energy (0 < Ω < 1), applied voltage waveform, resulting current and discharge radius.
 (13)where P, M, R and T are respectively air pressure (in Pa), molar mass of air (in g/mol), universal constant of perfect gases (in J/K.mol) and temperature of discharges (in K) [67]. Moreover, note that modelling of air density data with regression curves could be considered for the computation of velocity (Fig. 9c) [68]. As concerns temperature (T), it could be obtained according to the heat transfer balance equation, given in polar coordinates, thanks to Elenbaas–Heller model [69,70]:
 (14)where r, T, σ(T) and E are respectively discharges radius, thermal conductivity of discharges, electric conductivity of discharges and electric field. Then, a solution to equation (14) has been proposed by Frank–Kamenetski who have provided the expression of power dissipation (P) within the arc channel by thermal conduction as given below:
 (15)where KB = 1.3806e−23 m2 kg/(s2.K), and, Wi = 35.5 eV, are respectively the Boltzmann constant and the first ionization energy of the discharges channel. The thermal conductivity of the plasma channel could be approximated by expression (16):
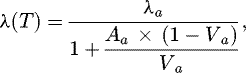 (16)where λa, Aa and Va are respectively thermal conductivity, kinetic gas coefficient and volume fraction altogether of air, as described in [71]; note also that λa depends on the discharge column temperature. The dependence of thermal conductivity on temperature has been taken into account and a regression data modelling, based on results available in [68,72,73] (Fig. 9), is presented in Table 1 with a prediction bounds factor pb of 90%. The regression analysis is carried out using sum of squared errors (SSE), root mean squared errors (RMSE), prediction quality factor (R2) and adjusted prediction factor (Adj. R2).
As shown in Table 1, three mathematical expressions among the most representative are suggested for solving equation (15), extrapolating and then computing the discharges axial temperature (T). However, considering the goodness of parametric evaluation fit of thermal conductivity data [68,72,73] (Fig. 9b), the following expression could be picked–up for an easier implementation:
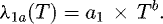 (17)
(17)
Then, by replacing (17) in (15) the axial temperature is obtained as shown in (18):
 (18)
(18)
The thermal conductivity of atmospheric air (P = 1.013 kPa) below 2000 K increases linearly as the temperature increases (Fig. 9a) while it increases according to a fitted power law curve (Eq. (9)) for T ≥ 3000 K (Fig. 9b). The atmospheric air density, computed with equation (13), decreases as the temperature increases reaching lower values at T = 3000 K. However, these computed values remain in well accordance with numerical data available in [68].
As shown in Figure 10, the relationship between temperature and electric field intensity at the HV needle is depicted by equation (10) and may be assumed to represent the electric conductivity σ(T). Actually, Figure 10 exhibits that the average discharges temperature increases as the electric field increases for all materials (Fig. 9a) with considerably enhanced value for polyamides reaching more than 3800 K whereas EPDM and FCEP require higher field magnitudes to reach 3600 K at most for FCEP. EPDM material inhibits the temperature rise in comparison to other polymers despite of elevated applied field thresholds. Moreover, the instantaneous variation of discharges temperature (Figures 9b and 9c) reveal that it is the most emphasized for PA6/50 equaling more than 5000 K. However, PA66/50 material shows a reduced temperature value (<5000 K) with less repetitive pulses. The temperature profile distribution for FCEP is the most stable due to a cushioned effect, induced by its thermo-gravimetric properties, that tends to decrease its value up to 2800 K (Fig. 10b). Nevertheless, EPDM decreases the temperature value below 3000 K but with the presence of many oscillations having higher magnitude (≈3500 K, Fig. 10c).
 |
Fig. 7 Variation of the average velocity of creeping discharges propagating on the FCEP surface influenced by (a) the fraction of available energy (Ω) and (b) the air density (ρ). |
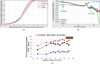 |
Fig. 8 Time-frequency properties of positive lightning impulse current: (a) Gaussian cumulative density at Ucrest = 27 kV; (b) frequency signature using AR covariance method; and (c) variation of power spectral density components according to applied voltage for PA6/50. |
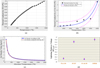 |
Fig. 9 Influence of temperature on atmospheric air properties (P = 1013 kPa): (a) thermal conductivity below 2000 K; (b) modelling of thermal conductivity at higher temperature (T ≤ 6000 K); (c) air density below 3000 K [68,71,72]; and, (d) crest values of flashover voltage (FOV). |
Analysis of regression parameters and adopted equations for thermal conductivity data of atmospheric air.
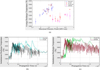 |
Fig. 10 Effects of the type of a material on the discharges temperature: (a) influence of the HV needle maximal field (Eq. (10)); (b) instantaneous distribution of temperature for PA6/50 and FCEP at Ucrest = 27 kV; and (c) for PA66/50 and EPDM. |
3.4 Electric conductivity of polymeric surfaces
The surface electric conductivity of tested solids is analyzed when creeping discharges propagate up to flashover. It is well known that surface conductivity and permittivity of a material influence greatly discharges patterns since they are closely related to their growth on insulators. More precisely, the length and number of discharges are found out to be more enhanced for polyamides at lower inception voltage levels because of their higher electric surface conductivity. However, discharges are much more inhibited on EPDM and FCEP due to their lower electric conductivity especially for EPDM. The conduction mechanism on the surface of polymers at higher electric fields and relatively lower surrounding temperatures is non-ohmic and relies upon the Schottky effect for which the potential barriers are reduced and an electron can pass across that barrier [74–76]. Similarly to the Poole-Frenkel effect occurring in the bulk of a material, the surface conductivity (σ) could be given by (19):
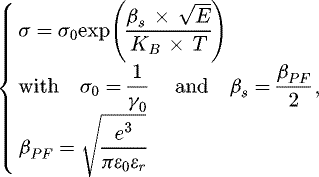 (19)
where σ0 and γ0 are respectively the intrinsic surface conductivity and resistivity of the material, βS and βPF are respectively the Schottky and Poole-Frenkel constants, E is the electric field magnitude, KB is the Boltzmann constant, T is the absolute temperature (in K), and e is the elementary charge of electron (1.602 × 10⁻¹⁹C).
(19)
where σ0 and γ0 are respectively the intrinsic surface conductivity and resistivity of the material, βS and βPF are respectively the Schottky and Poole-Frenkel constants, E is the electric field magnitude, KB is the Boltzmann constant, T is the absolute temperature (in K), and e is the elementary charge of electron (1.602 × 10⁻¹⁹C).
Consequently, the conductivity distribution on the surface of PA6/50, PA66/50, FCEP and EPDM has been calculated according to electric field values provided from the 2-D numerical model for Ucrest = 27 kV (Fig. 11) [21]. Generally, the electric surface conductivity reaches its highest value at the center of the polymeric specimen right under the H.V. needle then decreases as the axial distance (x’Ox) increases constituting such a heterogeneous conductive surface [77]. For polyamides (Fig. 11a), the predicted peak conductivity values are in the range of 10−12S (5.358 × 10⁻¹² S and 4.922 × 10⁻¹² S respectively for PA6/50 and PA66/50) while it is significantly reduced along both FCEP and EPDM surfaces that fall 10−16 S (8.545 × 10⁻¹⁶ S and 6.065 × 10⁻¹⁶ S respectively for FCEP and EPDM).
As highlighted in Figure 12, the discharges propagation along tested polymeric specimens (from sample middle at x = 0 mm up to its edges x = 40 mm) has been modeled based on their maximal electric surface conductivity which varies according to the electric gradient level. This results of a propagation domain that describes each material property similarly to a thermodynamic cycle. As a result, three regions are built-up and define the discharges ignition and growth process until flashover, namely: ignition, propagation and higher probability of surface breakdown. Moreover, it can be seen that the PA6/50 (Fig. 12a) cycle is the longest one having elevated conductivity values while the EPDM domain (Fig. 12b) is the smallest with the most reduced conductivity values. The PA66/50 domain (Fig. 12a) owns higher values but remains included within the PA6/50 cycle with approximately similar breakdown bounds. Nevertheless, conductivity values for FCEP (Fig. 12b) are slightly eccentric in comparison to the EPDM domain.
It is particularly noticed that increasing the field gradient increases the electric surface conductivity neighboring the HV needle electrode at the beginning of the domain and during discharges elongation having values that depend exclusively on the material’s intrinsic characteristics. However, increasing the field gradient level at specimen edges stabilizes the surface conductivity value without any visible effects.
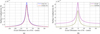 |
Fig. 11 Estimated profile distribution of electric surface conductivity for various polymers based on the 2-D numerical model [21] under positive lightning impulse voltage at Ucrest = 27 kV: (a) PA6/50 versus PA66/50; and (b) FCEP versus EPDM. |
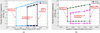 |
Fig. 12 Representation of surface electric conductivity domain (cycle) for the characterization of creeping discharges propagation over tested polymers: (a) PA6/50 versus PA66/50; and (b) FCEP versus EPDM. |
3.5 Charging of electric particles
In previous works [20,21], the computation of electric field at the surface of HV needle using analytical and numerical methods evidenced a remarkable difference between both approaches likely thought to be the reason of two parameters namely: (i) charged particles originating from creeping discharges, and (ii) polarization phenomena because of the largest frequency content of lightning current (f ≤ 250 MHz) influencing particles motion and their spatial orientation (Fig. 8b).
Space charges are sensitive to the nature and polarity of electrodes and are known to induce significant variations of the electric field leading, in most cases, to decrease or increase its intensity in the presence of insulating barriers [21]. The generated space charges under positive polarity increase the electric field magnitude. Actually, that effect has not been considered in our simulations clarifying the noticeable difference between predicted values of the 2-D model and the analytical method [78]. Nevertheless, it could be stated that it is a good thing to get over-estimated values from numerical models in comparison to analytical methods since numerical computations guarantee a minimum safety factor in regards to the design and optimization of H.V. equipment and devices. Generally, the generated charges quantity (Q), for a fixed applied voltage level, may be calculated according to the expression (20) as in the following:
 (20)
(20)
The main contribution of space charges (Qc) is to increase the voltage level by acting additionally to the applied electric field resulting of a slight elevation in its magnitude as it may be formulated in expression (21):
 (21)
where Q1 is the quantity of electric charges without the effect of space charges. In addition, one can compute the cumulative electric charges magnitude (qic) and consider it as a comparative electrostatic index (C.E.I.) of solid dielectrics that may identify the electrostatic hazard degree of polymeric materials, at each voltage value, based on expression (22):
(21)
where Q1 is the quantity of electric charges without the effect of space charges. In addition, one can compute the cumulative electric charges magnitude (qic) and consider it as a comparative electrostatic index (C.E.I.) of solid dielectrics that may identify the electrostatic hazard degree of polymeric materials, at each voltage value, based on expression (22):
 (22)
(22)
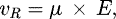
In Figure 13, the generation of electric charges reaches its highest amount for polyamides while FCEP and EPDM depict a lower quantity of charges clarifying their smaller length regardless the applied voltage value (Fig. 13a). In addition, the effect of space charges is also investigated revealing that the induced voltage is remarkably elevated for polyamides whereas FCEP and EPDM induce a voltage level lower than 600 V for Ucrest=27 kV (Fig. 13b). Finally, the computation of cumulative charges demonstrates that polyamides are more sensitive to the electric stress than FCEP or EPDM due to their noticeable electrostatic charging tendency (E.C.T.) as shown in Figure 13c.
As the polarization of materials is concerned too, the elevated frequency range of LI signals may have an impact on the relative permittivity of polymers (εr′) by modifying its value at higher frequencies (Fig. 8c). This outlines the lower values for the numerical model in comparison to the analytical one [21]. Further interests should be especially paid to the type of fillers, their geometrical shapes and their volume fraction within the polymer matrix for their contribution in polarization phenomena [79].
More precisely, the spatial organization of discharges in a tree filamentary structure is strongly correlated with electric charges that are induced on a dielectric surface. Actually, the first electric discharge that forms on the dielectric plate deposits surface charges close to its center and affect significantly the subsequent discharges orientation and the plasma filaments dimensions leading to build-up a stronger branching shape [80]. As streamers heads generate substantial electrical charges of equal polarity by which the local electric field is emphasized, streamers clearly repel or attract each other electrostatically resulting of the well-known Lichtenberg depicted shape [81]. Thus, the more surface charges are produced on materials, the higher is the filamentary structure of discharges.
Regarding tested materials, a higher amount of electric charges for polyamides (PA6/50, PA66/50) reflects the appearance of multiple filamentary discharges (Fig. 14i and ii) while a relatively lower charges quantity for FCEP (Fig. 14iii) and EPDM (Fig. 14iv) corresponds to the growth of a few or even one short discharge filament despite of elevated applied voltage levels (U > 32 kV+).
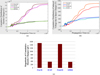 |
Fig. 13 Influence of the type of used polymer on the generation of electric charges during discharges propagation under positive lightning impulse voltage at Ucrest=27 kV: (a) temporal accumulation of electric charges (Q); (b) temporal distribution of induced voltage due to space charges; and (c) comparison of cumulative charges magnitudes (qic). |
 |
Fig. 14 Photographic views of creeping discharges propagation and advancement up to flashover over various polymeric materials at atmospheric pressure and under positive lightning impulse voltage, (i) PA6/50, (ii) PA66/50, (iii) FCEP, and (iv) EPDM. |
3.6 Movement of charged particles
In gases, charged particles move quickly in all directions and gain kinetic energy resulting of colliding elastically frequently with each other because of applied electric stress and temperature elevation with no loss of energy [82]. Actually, the application of an electric field induces a force that is responsible of particles motion in the same direction or oppositely to the generated field depending on charges being positive or negative. These particles may be ionized under certain circumstances leading to considerably increase their kinetic energy and to accelerate their movement randomly in space inducing a heavy light emitting channel.
In this section, the study of particles mobility, their thermodynamic entropy in space as well as the mechanical pressure by which axially charged particles are propelled, are analyzed and computed in a point − dielectric barrier − plane system. As shown in Fig. 15a, the average mobility of charges (μ) has been depicted according to the provided electric power for each tested polymeric specimen based on the equation (23) as in the following:
 (23)
where vR and E are respectively the average velocity value and the electric field magnitude both calculated in [21]. It is evidenced (Fig. 15a) that polyamide based materials (PA6/50 and PA66/50) increases the mobility of charges as the provided electric power increases with noticeable elevated values for PA6/50 likely due to its higher particles ionization degree (μ ≤ 14 cm2/V.s). As FCEP is concerned, the material absorbs a large part of the electric power inducing the slowest mobility of charges due to a reduced amount of electric power provided to the ionization of particles (μ ≤ 8 cm2/V.s). For EPDM, note that the absorption of electric power is greater than that of FCEP despite of higher value of mobility recorded neighboring 3 or 5.7 Watts of electric power (μ ≤ 10 cm2/V.s).
(23)
where vR and E are respectively the average velocity value and the electric field magnitude both calculated in [21]. It is evidenced (Fig. 15a) that polyamide based materials (PA6/50 and PA66/50) increases the mobility of charges as the provided electric power increases with noticeable elevated values for PA6/50 likely due to its higher particles ionization degree (μ ≤ 14 cm2/V.s). As FCEP is concerned, the material absorbs a large part of the electric power inducing the slowest mobility of charges due to a reduced amount of electric power provided to the ionization of particles (μ ≤ 8 cm2/V.s). For EPDM, note that the absorption of electric power is greater than that of FCEP despite of higher value of mobility recorded neighboring 3 or 5.7 Watts of electric power (μ ≤ 10 cm2/V.s).
Moreover, a better description of the charged particles motion may be assessed through the Steenbeck’s entropy (ΔSSt) usually employed in non-equilibrium thermodynamics and is given by (24) [82,83]:
 (24)
where P (in Watt) and T (in K) are respectively the average electric power and the axial discharges channel temperature computed in equations (8) and (18). Figure 15b evidenced that the increase of average discharges energy increases, in general, linearly the value of Steenbeck’s entropy for all tested materials except for EPDM. It is observed that polyamides influence tremendously the entropy of charged particle within the discharges channel as the energy value increases while FCEP and EPDM interfaces seem to stabilize the particles motion. Note also that EPDM avoids more than FCEP a wider dispersion of charged particles within the discharges channel during its propagation.
(24)
where P (in Watt) and T (in K) are respectively the average electric power and the axial discharges channel temperature computed in equations (8) and (18). Figure 15b evidenced that the increase of average discharges energy increases, in general, linearly the value of Steenbeck’s entropy for all tested materials except for EPDM. It is observed that polyamides influence tremendously the entropy of charged particle within the discharges channel as the energy value increases while FCEP and EPDM interfaces seem to stabilize the particles motion. Note also that EPDM avoids more than FCEP a wider dispersion of charged particles within the discharges channel during its propagation.
Furthermore, the dispersion of particles is induced by a mechanical pressure (PM) resulting of an external force (Fext) which propels charges axially along a surface (S) and may be calculated according to equation (25):
 (25)
(25)
The force || || is computed according to expression (26):
 (26)
where ||
(26)
where || || is the discharges momentum module given by (27):
 (27)
(27)
The mass md is computed according to (28) as in the following:
 (28)
(28)
Finally, the propelled surface S is estimated according to (29) based on the fact that the discharges channel propagates into a cylindrical shape:
 (29)
(29)
Figure 15c exhibits the dependence of maximal discharges propellinpressure on the material’s surface and discharges length. It is generally noticed that the discharges extension increases a little bit the average propelling pressure especially for FCEP and PA6/50 materials whereas that for PA66/50 and EPDM remains constant and below 0.5 Pa. Nevertheless, the computation of PMmax, with MATLAB® using the differential equation function “diff”, may sometimes show higher values for PA66/50 (8.6573 Pa at Ucrest = 25.5 kV) and EPDM (19.0657 Pa at Ucrest = 28 kV) and the highest one for FCEP also (1.4503 kPa at Ucrest = 28 kV). In addition, the graphical diagram infers the existence of a maxima pressure values, obtained at a particular voltage level/discharges length, easily noticed for PA6/50 (Lf = 18.393 mm) and FCEP (Lf = 12.536 mm) for instance, that is similar to relaxation phenomena observed for dielectrics [84].
 |
Fig. 15 Physical description of charged particles movement within discharges channels during their propagation over various materials: (a) Average mobility of particles; (b) Steenbeck’s entropy; (c) Maximal propelling pressure; and (d) Instantaneous discharges propelling pressure (Ucrest = 27 kV). |
4 Conclusion
The present study investigates the ignition of surface discharges and their propagation over various solid dielectrics under the positive lightning impulse voltage. The analysis of their morphology reveals that polyamide materials enhances their length as well as their channel radius at lower voltage levels due to their higher surface conductivity which promotes drastically their growth contrary to FCEP and EPDM materials. More precisely, the propagation of creeping discharges is mainly governed by two competing mechanisms that produce the electrical treeing structure namely (i) repulsion due to electrostatic forces, and (ii) attraction because of nonlocal photo-ionization.
The computation of electric power and energy amounts evidenced that FCEP and EPDM interfaces reduce considerably their value despite of higher voltage levels, oppositely to polyamides, which is likely due to their absorption property mainly responsible for the reduction of discharges growth and advancement.
It is shown that the discharges velocity is greatly influenced by many parameters such as energy fraction (Ω) or air density (ρ). This latter is affected by the discharges temperature found to be more elevated for polyamides in comparison to FCEP or EPDM polymers.
As the charging tendency is concerned, it is observed that the generation of electric charges is remarkably higher for polyamides due to their sensitivity to the electric field whereas FCEP and EPDM interfaces induces lower charges. The distribution of the discharges filamentary structure and its treeing shape rely on the produced electric charges amount which depends on the polymeric material.
The examination of charged particles movement demonstrates that their mobility is noticeably accelerated when using polyamides while FCEP and EPDM tend to inhibit their motion. Indeed, the calculation of the thermodynamic entropy reflects the particles activity in space which is elevated for polyamide solids and reduced for FCEP and EPDM. Moreover, the computation of the propelling pressure exhibits the existence of relaxation phenomena by which discharges may sometimes be pushed far ahead especially in the case of polyamides.
The experimental findings related to the present survey suggest many efficient future applications of discharges plasma such as: ozone generation from air and oxygen, removal of toxic agents from polluted air, gases or liquids, surface treatment of solid materials, greenhouse gas recycling, UV lamps or various utilizations in DBD barrier technologies.
Author’s contribution statement
Dr. Mohammed Adnane DOUAR carried out the experiments, developed the theoretical formalism and framework, performed computations and results interpretations, and wrote the present manuscript with support and supervision from Prof. Abderrahmane BEROUAL as Head of the research project. Xavier SOUCHE managed accounting operations including ordering and purchasing of polymeric samples as well as some measurement devices, and participated to the improvement of the paper by suggesting fruitful ideas.
Acknowledgment
The authors would like to express their grateful acknowledgment to the company “Sicame Group S.A.” and “Région Limousin”, from France, for having provided financial supports and technical suggestions to the present research project referenced as “CONVENTION CIFRE No. 2011/1237” by “Agence Nationale de Recherche et Technologie (ANRT)” in France.
References
- G.C. Montanari, IEEE Electr. Insul. Mag. 29, 34 (2013) [CrossRef] [Google Scholar]
- R.A. Fouracre, S.J. MacGregor, F.A. Tuema, An investigation into the mechanisms of surface discharges, in 12th Int. Pulsed Power Conf. (IPPC), 1999, p. 1380 [Google Scholar]
- A. Cavalini, F. Ciani, G.C. Montanari, The effect of space charge on phenomenology of partial discharges in insulation cavities, in IEEE Ann. Rep. Conf. Electr. Insul. Dielec. Phen., 2005, p. 410 [Google Scholar]
- D. Yu, M. Farzaneh, J. Zhang, L. Shu, W. Sima, C. Sun, IEEE Trans. Dielec. Electr. Insul. 14, 1427 (2007) [CrossRef] [Google Scholar]
- M. Mahdipour, A. Akbari, P. Werle, IEEE Trans. Dielec. Electr. Insul. 24, 817 (2017) [CrossRef] [Google Scholar]
- T.G. Engel, M. Kristiansen, IEEE Trans. Plasma Sci. 37, 1863 (2009) [CrossRef] [Google Scholar]
- Z. Aydogmus, M. Cebeci, IEEE Trans. Dielec. Electr. Insul. 11, 577 (2004) [CrossRef] [Google Scholar]
- M. Albano, R.T. Waters, P. Charalampidis, H. Griffiths, A. Haddad, IEEE Trans. Dielec. Electr. Insul. 23, 304 (2016) [CrossRef] [Google Scholar]
- J. Crespo-Sandoval, A. Haddad, H. Griffiths, P.F. Coventry, IEEE Trans. Dielec. Electr. Insul. 17, 1772 (2010) [CrossRef] [Google Scholar]
- S.M. Rowland, R. Schurch, M. Pattouras, Q. Li, IEEE Trans. Dielec. Electr. Insul. 22, 1537 (2015) [CrossRef] [Google Scholar]
- F. Mauseth, E. Ildstad, M. Ytterstad, R. Hegerberg, B. Sanden, M. Jeroense, J.E. Skog, Quality control of HVDC extruded cables: electrical treeing in XLPE under different voltage stresses, in Proc. 16th Int. Symp. High Volt. Eng., 2009, ISBN 978-0-620-44584–9 [Google Scholar]
- X. Chen, Y. Xu, X. Cao, S.M. Gubanski, IEEE Trans. Dielec. Electr. Insul. 23, 103 (2016) [Google Scholar]
- D. Shakti Prasad, B. Subba Reddy, IEEE Trans. Dielec. Electr. Insul. 24, 75 (2017) [CrossRef] [Google Scholar]
- S. Pancheshnyi, Plasma Sources Sci. Technol. 24, 1 (2015) [Google Scholar]
- S. Farokhi, M. Farzaneh, I. Fofana, J. Phys. D: Appl. Phys. 43, 1 (2010) [CrossRef] [Google Scholar]
- P.N. Mavroidis, P.N. Mikropoulos, C.A. Stassinopoulos, M. Zinonos, Impulse breakdown of short rod-plane gaps with a rod covered different dielectric materials, in Proc. 16th Int. Symp. High Volt. Eng. (SAIEE), 2009, pp. 1 [Google Scholar]
- L.A. Lazaridis, P.N. Mikropoulos, IET Sci. Meas. Technol. 4, 63 (2010) [CrossRef] [Google Scholar]
- I. Fofana, A. Beroual, A. Boubakeur, Influence of insulating barriers on positive long air gaps in divergent field, in 11th Int. Symp. High Volt. Eng., 1999, p. 321 [Google Scholar]
- Y. Ding, F. Lv, Z. Zhang, C. Liu, J. Geng, Q. Xie, IEEE Trans. Plasma. Sci. 44, 2615 (2016) [CrossRef] [Google Scholar]
- M.A. Douar, A. Beroual, X. Souche, IET Gener. Transm. Distr. 12, 1417 (2018) [Google Scholar]
- M.A. Douar, A. Beroual, X. Souche, IET Gener. Transm. Distr. 12, 1429 (2018) [Google Scholar]
- L. Kebbabi, A. Beroual, IEEE Trans. Dielec. Electr. Insul. 13, 565 (2006) [CrossRef] [Google Scholar]
- N. Dhahbi-Megriche, A. Beroual, IEEE Trans. Dielec. Electr. Insul., 23, 2899 (2016) [CrossRef] [Google Scholar]
- I. Fofana, Modélisation de la décharge positive dans les grands intervalles d’air, Ph.D. Thesis, Ecole Centrale de Lyon, France, 1996 [Google Scholar]
- A. Beroual, M.-L. Coulibaly, O. Aitken, A. Girodet, IET Gen. Trans. Distr. 6, 951 (2012) [CrossRef] [Google Scholar]
- H. Okubo, M. Kanegami, M. Hikita, Y. Kito, IEEE Trans. Dielec. Electr. Insul. 1, 294 (1994) [CrossRef] [Google Scholar]
- M.-L. Coulibaly, A. Beroual, O. Aitken, A. Girodet, Int. Conf. High Volt. Eng. Appl. (ICHVE), 24, (2008) [Google Scholar]
- M.-L. Coulibaly, A. Beroual, O. Aitken, A. Girodet, Experimental characterization of creeping discharges over solid/gas and solid/gaseous mixture interfaces under lightning impulse voltage, in 17th Int. Conf. Gas. Disch. Appl. (ICGD), 2008, pp. 265 [Google Scholar]
- A. Beroual, M.-L. Coulibaly, O. Aitken, Girodet, A. Study of creeping discharges propagating over epoxy resin insulators in presence of different gas mixtures, in Int. Conf. High Volt. Eng. Appl. (ICHVE), 2010, pp. 89 [Google Scholar]
- A. Beroual, M.-L. Coulibaly, Fractal analysis of creeping discharges propagating over solid insulators immersed in gases at different pressures, in IEEE Conf.Electr. Insul. Dielec. Phen. (CEIDP), 2012, pp. 335 [Google Scholar]
- A. Beroual, A. Kebbabi, IEEE Trans. Dielec. Electr. Insul. 16, 1574 (2009) [CrossRef] [Google Scholar]
- M.A. Douar, A. Beroual, X. Souche, Propagation of creeping discharges in air depending on the electric field direction and insulator materials under lightning impulse voltage, in IEEE Conf.Electr. Insul. Dielec. Phen. (CEIDP), 2015, pp. 880 [Google Scholar]
- Y.V. Serdyuk, A. Larsson, S.M. Gubanski, M. Akyuz, J. Phys. D: Appl. Phys. 34, 614 (2001) [CrossRef] [Google Scholar]
- N. Liu, S. Célestin, A. Bourdon, V.P. Pasko, P. Ségur, E. Marode, Appl. Phys. Lett., AIP, 91, 112501-1 (2007) [Google Scholar]
- N.Y. Liu, V.P. Pasko, J. Geophys. Res. 109, (2004). DOI:10.1029/2003JA010064 [Google Scholar]
- L.B. Loeb, Science 148, 1417 (1965) [Google Scholar]
- M.I. D’yakonov, V.Y. Kashorovskii, J. Exp. Theo. Phys. 67, 1049 (1988) [Google Scholar]
- G.A. Dawson, W.P. Winn, Zeit. Phyz., 183, 159 (1965) [CrossRef] [Google Scholar]
- X. Zhang, S.M. Rowland, IEEE Trans. Dielec. Electr. Insul. 19, 2055 (2012) [CrossRef] [Google Scholar]
- R. Genin, J. Phys. Radium, 17, 571 (1956) [CrossRef] [EDP Sciences] [Google Scholar]
- I. Gallimberti, J. Phys. D: Appl. Phys. 5, 2179 (1972) [CrossRef] [Google Scholar]
- N.L. Allen, A. Ghaffar, J. Phys. D: Appl. Phys. 28, 331 (1995) [CrossRef] [Google Scholar]
- A.A. Kulikovsky, J. Phys. D: Appl. Phys. 30, 441 (1997) [CrossRef] [Google Scholar]
- S. Rauf, M.J. Kushner, 1998. The consequence of cell geometry and gas mixture on plasma display panel performance, in IEEE Int. Conf. Plasma Sci. Raleigh (NC), USA, pp. 124. [Google Scholar]
- N.L. Aleksandrov, E.M. azelyan, J. Phys. D: Appl. Phys. 29, 740 (1996) [CrossRef] [Google Scholar]
- T.M.P. riels, E.M. Van Veldhuizen, U. Ebert, IEEE Trans. Plasma. Sci. 36, 908 (2008) [CrossRef] [Google Scholar]
- N.C. Jaintly, T.S. Sudarshan, IEEE Trans. Dielec. Electr. Insul. 23, 261 (1988) [CrossRef] [Google Scholar]
- T. Asokan, T. Sudarshan, IEEE Trans. Dielec. Electr. Insul. 27, 1040 (1992) [CrossRef] [Google Scholar]
- R.G. Bommakanti, T.S. Sudarshan, J. Appl. Phys., 66, 2091 (1989) [Google Scholar]
- S. Grzybowski, J.E. Thompson, E. Kuffel, IEEE Trans. Electr. Insul. 18, 301 (1983) [CrossRef] [Google Scholar]
- F. Hegeler, G. Masten, H. Krompholz, L.L. Hatfield, IEEE Trans. Plasma Sci., 21, 223 (2002) [CrossRef] [Google Scholar]
- F.W. Peek, Dielectric Phenomena in High Voltage Engineering (McGraw Hill Comp. Inc., New York, 1915) 1st edn. [Google Scholar]
- I. Gallimberti, G. Bacchiega, A. Bondieou-Clergerie, P. Lalande, C. R. Phys. 3, 1335 (2002) [Google Scholar]
- N.L. Allen, P.N. Mikropoulos, J. Phys. D: Appl. Phys. 32, 913 (1999) [CrossRef] [Google Scholar]
- J.J. Lowke, IEEE Trans. Plas. Sci. 32, 4 (2004) [CrossRef] [Google Scholar]
- G.V. Naidis, J. Phys. D. Appl. Phys. 30, 1214 (1997) [Google Scholar]
- G.V. Naidis, J. Phys. D: Appl. Phys. 29, 779 (1996) [CrossRef] [Google Scholar]
- N.Y. Babaeva, G.V. Naidis, IEEE Trans. Plasma Sci. 26, 41 (1998) [CrossRef] [Google Scholar]
- M. Akyuz, L. Gao, V. Cooray, T.G. Gustavsson, S.M. Gubanski, A. Larsson, IEEE Trans. Dielec. Electr. Insul. 8, 902 (2001) [CrossRef] [Google Scholar]
- X. Meng, H. Mei, C. Chen, L. Wang, Z. Guan, J. Zhou, IEEE Trans. Dielec. Electr. Insul. 22, 1193 (2015) [CrossRef] [Google Scholar]
- G.V. Naidis, Tech. Phys. Lett. 23, 493 (1997) [CrossRef] [Google Scholar]
- N.Y. Babaeva, G.V. Naidis, IEEE Trans. Plasma Sci. 25, 375 (1997) [CrossRef] [Google Scholar]
- A.V. Chvyreva, Creeping sparks: a study on surface discharges development. Ph.D. dissertation, T.U. Eindhoven, Holland, 2016 [Google Scholar]
- A. Xiao, S.M. Rowland, X. Tu, J.-C. Whitehead, IEEE Trans. Dielec. Electr. Insul. 21, 2466 (2014) [CrossRef] [Google Scholar]
- C. Perrier, A. Beroual, J.-L. Bessede, IEEE Trans. Dielectr. Electr. Insul. 13, 556 (2006) [Google Scholar]
- M. El-A. Slama, Etude expérimentale et modélisation de l’influence de la constitution chimique et de la répartition de la pollution sur le contournement des isolateurs haute tension, Ph.D. Thesis, Ecole Centrale de Lyon, France, 2011 [Google Scholar]
- https://fr.wikipedia.org/wiki/Masse_volumique_de_l%27air [Google Scholar]
- htps://www.thermalfluidscentral.org/encyclopedia/index.php/thermophysical_Properties:Air_at_1_atm [Google Scholar]
- M.El-A. Slama, A. Beroual, H. Hadi, Electro-thermal model of DC flashover discharges of polluted insulator, in 18th Int. Symp. High Volt. Eng. (ISH), 2013, pp. OE3–02. [Google Scholar]
- M. El-A. Slama, A. Beroual, H. Hadi, Experimental characterization and mathematical modelling of surface flashover of solid insulator in air, in 19th Int. Symp. High Volt. Eng. (ISHVE), 2015, p. 1 [Google Scholar]
- N. Dhahbi-Megriche, A. Beroual, L. Krähenbühl, J. Phys. D: Appl. Phys. 30, 889 (1997) [CrossRef] [Google Scholar]
- https://www.engineeringtoolbox.com/dry-air-properties-d_973.html [Google Scholar]
- http://thermopedia.com/content/553/ [Google Scholar]
- H. Yahyaoui, P. Nothingher, S. Agnel, Y. Kieffel, A. Girodet. Analysis of conduction mechanisms in alumina-filled epoxy resin under dc field and temperature, in IEEE Ann.Rep. Conf. Electr. Insul. Dielec. Phen. (CEIDP), 2013, 667 [Google Scholar]
- T. Vu-Cong, A. Beroual, A. Girodet, P. Vinson, Time constant evaluation of transient AC−DC field distribution, in 19th Int. Symp. High Volt. Eng. (ICHVE), 2015 [Google Scholar]
- G.R.G. Raju, Electrical conduction in aromatic polyamides, in Proc. 19th Electr.Electro. Insul. Conf. (EEIC/ICWA), 78, 1989 [Google Scholar]
- A. Rahmani, A. Boubakeur, S.A.A. Boumaza, A. Mekhaldi, M. Matallah, Arch. Electr. Eng. 58, 97 (2009) [Google Scholar]
- E. Kantar, D. Panagiotopoulos, E. Ilstad, IEEE Trans. Dielec. Electr. Insul. 23, 1778 (2016) [CrossRef] [Google Scholar]
- S. Orlowska, A. Beroual, J. Fleszynski, J. Phys. D: Appl. Phys. 35, 1 (2002) [CrossRef] [Google Scholar]
- S. Célestin, Study of the dynamics of streamer in air at atmospheric pressure. Ph.D. dissertation, École Centrale de Paris, France, 2008 [Google Scholar]
- A. Luque, U. Ebert, W. Hundsdorfer, Phys. Rev. Lett. 101, 75005-1 (2008) [Google Scholar]
- K. Kumar, R.E. Robson, Aust. J. Phys. 26, 157 (1973), (NASA Astrophysics Data System) [CrossRef] [Google Scholar]
- M.S. Benilov, G.V. Naidis, J. Phys. D: Appl. Phys. 43, 175204 (2010) [CrossRef] [Google Scholar]
- A. Medjdoub, A. Boubakeur, ‘Influence of electrical aging on the properties of cross-linked polyethylene use as electrical insulation on underground power cables, in IEEE Conf.Power Tech. (PTC), 2005, p. 1 [Google Scholar]
Cite this article as: Mohammed Adnane Douar, Abderrahmane Beroual, Xavier Souche, Ignition and advancement of surface discharges at atmospheric air under positive lightning impulse voltage depending on perpendicular electric stress and solid dielectrics: modelling of the propagating phenomenology, Eur. Phys. J. Appl. Phys. 82, 20801 (2018)
All Tables
Analysis of regression parameters and adopted equations for thermal conductivity data of atmospheric air.
All Figures
|
Fig. 1 Descriptive diagram of the electrical breakdown process occurring in air over an insulator surface through the Townsend mechanism [6]. |
| In the text | |
|
Fig. 2 Chemical functional groups of investigated materials, (a) polyamides (PA6/50 and PA66/50), (b) cycloaliphatic epoxy resin (FCEP) and (c) EPDM elastomer. |
| In the text | |
|
Fig. 3 Influence of the type of a material interface and the applied field gradient on (a) the average discharges’ radius and (b) the average volume. |
| In the text | |
|
Fig. 4 Temporal distribution of the average discharges volume at Ucrest = 27 kV for (a) PA6/50 versus FCEP and (b) PA66/50 versus EPDM. |
| In the text | |
|
Fig. 5 Effects of the type of a material and the value of field gradient on (a) average electric power and (b) average energy of discharges. |
| In the text | |
|
Fig. 6 Temporal distribution of the discharges energy at Ucrest = 27 kV for (a) PA6/50 versus FCEP and (b) PA66/50 versus EPDM. |
| In the text | |
|
Fig. 7 Variation of the average velocity of creeping discharges propagating on the FCEP surface influenced by (a) the fraction of available energy (Ω) and (b) the air density (ρ). |
| In the text | |
|
Fig. 8 Time-frequency properties of positive lightning impulse current: (a) Gaussian cumulative density at Ucrest = 27 kV; (b) frequency signature using AR covariance method; and (c) variation of power spectral density components according to applied voltage for PA6/50. |
| In the text | |
|
Fig. 9 Influence of temperature on atmospheric air properties (P = 1013 kPa): (a) thermal conductivity below 2000 K; (b) modelling of thermal conductivity at higher temperature (T ≤ 6000 K); (c) air density below 3000 K [68,71,72]; and, (d) crest values of flashover voltage (FOV). |
| In the text | |
|
Fig. 10 Effects of the type of a material on the discharges temperature: (a) influence of the HV needle maximal field (Eq. (10)); (b) instantaneous distribution of temperature for PA6/50 and FCEP at Ucrest = 27 kV; and (c) for PA66/50 and EPDM. |
| In the text | |
|
Fig. 11 Estimated profile distribution of electric surface conductivity for various polymers based on the 2-D numerical model [21] under positive lightning impulse voltage at Ucrest = 27 kV: (a) PA6/50 versus PA66/50; and (b) FCEP versus EPDM. |
| In the text | |
|
Fig. 12 Representation of surface electric conductivity domain (cycle) for the characterization of creeping discharges propagation over tested polymers: (a) PA6/50 versus PA66/50; and (b) FCEP versus EPDM. |
| In the text | |
|
Fig. 13 Influence of the type of used polymer on the generation of electric charges during discharges propagation under positive lightning impulse voltage at Ucrest=27 kV: (a) temporal accumulation of electric charges (Q); (b) temporal distribution of induced voltage due to space charges; and (c) comparison of cumulative charges magnitudes (qic). |
| In the text | |
|
Fig. 14 Photographic views of creeping discharges propagation and advancement up to flashover over various polymeric materials at atmospheric pressure and under positive lightning impulse voltage, (i) PA6/50, (ii) PA66/50, (iii) FCEP, and (iv) EPDM. |
| In the text | |
|
Fig. 15 Physical description of charged particles movement within discharges channels during their propagation over various materials: (a) Average mobility of particles; (b) Steenbeck’s entropy; (c) Maximal propelling pressure; and (d) Instantaneous discharges propelling pressure (Ucrest = 27 kV). |
| In the text | |
Current usage metrics show cumulative count of Article Views (full-text article views including HTML views, PDF and ePub downloads, according to the available data) and Abstracts Views on Vision4Press platform.
Data correspond to usage on the plateform after 2015. The current usage metrics is available 48-96 hours after online publication and is updated daily on week days.
Initial download of the metrics may take a while.