| Issue |
Eur. Phys. J. Appl. Phys.
Volume 81, Number 1, January 2018
|
|
|---|---|---|
| Article Number | 10801 | |
| Number of page(s) | 9 | |
| Section | Plasma, Discharges and Processes | |
| DOI | https://doi.org/10.1051/epjap/2017170149 | |
| Published online | 30 January 2018 | |
https://doi.org/10.1051/epjap/2017170149
Regular Article
Modification of surface characteristic and tribo-electric properties of polymers by DBD plasma in atmospheric air
1
Institut Pprime, UPR 3346, CNRS - Université de Poitiers − ENSMA, IUT d'Angoulême,
4 Avenue de Varsovie,
16021
Angoulême, France
2
LSTE Laboratory, M.S Mascara University,
BP 305,
Mascara
29000, Algeria
3
APELEC Laboratory, Djilalli Liabes University,
Sidi Bel Abbes
22000, Algeria
4
Institut Pprime, CNRS, Université de Poitiers, ISAE-ENSMA,
86962
Futuroscope Chasseneuil, France
* e-mail: This email address is being protected from spambots. You need JavaScript enabled to view it.
Received:
24
April
2017
Received in final form:
16
June
2017
Accepted:
22
November
2017
Published online: 30 January 2018
Abstract
The aim of this paper is to quantify the effects of dielectric barrier discharge (DBD) exposure on the physico-chemical and tribo-electric properties of polymers. The study was conducted in atmospheric air on polypropylene, polyethylene and polyvinyl-chloride. These three types of polymers are widely used in industry. The polymers were characterized by means of an optical profilometer, a fourier-transform infrared (FTIR) spectrometer and an electric charge measurement system. The latter is composed of a Faraday pail connected to an electrometer. The profilometer analyses showed that the DBD plasma treatment has increased the surface roughness of the three polymers. FTIR revealed that oxygen atoms and polar groups were grafted on their surfaces, thereby conferring them a hydrophilic character. The short (2 sec) DBD plasma treatment has considerably improved the electrostatic charge acquired by the polymers during electrostatic tribo-charging, while longer exposures conferred the polymer anti-static properties and decreased its tribo-charging capability. The correlation between the results of the physico-chemical analyses and the tribo-electric behavior has been discussed.
© EDP Sciences, 2018
1 Introduction
Various physical, chemical and biological techniques have been developed for polymer surface modification [1,2]. Key properties conferred by these technologies include wettability, adhesion, chemical affinity and biocompatibility [3–6]. Surface modification is used in many fields: from automotive and aerospace industries, to the manufacturing of electronic and bio-medical devices [2,7,8]. Among various surface modification techniques, plasma treatment is very interesting because it is very easy to implement in the industry. The main plasma interactions with the polymer surface can be resumed to activation, cross-linking, etching or combination of these mechanisms [9–18]. Many studies have been performed during the last 15 years [19,20]. For example, Ren et al. [21] and Zhang et al. [22] modified the polyethylene film surface and coated it with metallic material. They both found that the peel adhesive strength between the metallic film and the DBD treated sample is increased compared to the untreated one. In addition, Kostov et al. [23] and Zheng Niu et al. [24] reported a water contact angle decrease and an enhanced wettability of the non-thermal plasma-treated polyethylene terephthalate (PET), polyurethane (PU) and polytetrafluoroethylene (PTFE).
A number of studies have been performed in order to see the effect of plasma treatment on the polymers' electrostatic charge; for example, Sharma et al. [25–27] worked on the treatment of polystyrene (PS) powders, acrylics and polyethylene (PE) films using argon, helium and air plasma. They have shown that plasma treatment decreases the specific tribo-charge acquired by the polymers as well as the surface resistivity of the samples. Takashima et al. [28] have reported in their work that the treatment of polypropylene (PP) and PE with any type of plasma helps to eliminate electrostatic charges. Tekeda et al. [29] and Kodama et al. [30] have shown that plasma treatment can improve the control of polymer charge. Despite the fact that the researches in this area appear to be numerous; the effect of plasma treatment on electrostatic charge remains quite unclear and should be further investigated. Some results are relatively contradictory, such as those of Murata et al. [31] and Chongqi et al. [32]. Both research teams studied the tribo-electric charge of air plasma treated PS. While Murata et al. observed an improvement in the frictional charge; Chongqi et al. reported a decrease in the charge density and an antistatic character of the treated samples.
The aim of the present work is to quantify the effect of plasma treatment on the tribo-electric properties of certain polymers by using an atmospheric dielectric barrier discharge (DBD). This type of discharge is a very promising technology for surface processing because it does not need any expensive vacuum system [14,33,34], and uses no expensive gas. The DBD plasma is obtained using two electrodes with an interposed dielectric material; this latter is used to avoid the transition to arc regime and to distribute the discharge in to the entire gas gap. The electrodes are in general powered with an alternating high voltage at frequencies of up to several kHz [35–37].
The present work reports the modifications induced by DBD plasma on the surface of three types of polymers commonly used in industry: PP, PE and polyvinyl chloride (PVC). The work focuses on the study of roughness, of chemical composition of their surfaces and of their tribo-electric properties after their exposure to DBD plasma in air, at atmospheric pressure. This study will contribute to enrich the previous investigations on plasma processing technologies.
2 Methodology
All the experiments were performed under stable ambient conditions. Thus, the temperature ranged between 19.4 and 21 °C, and the relative humidity between 56 and 60%.
2.1 Materials
The first series of experiments were carried out on square-shaped polymer slabs (15 × 15 cm). Each type of polymer slab was cut from a single large sheet. Slabs of the same polymer have the same characteristics. The reason behind the use of planar pieces of polymers is that their flat and homogeneous surfaces are much appropriate for the use of the optical profilometry tool and the fourier-transform infrared (FTIR) spectroscopy. Thereby they allow a reproducible study of the DBD plasma exposure effects; which is very difficult with granules of random shapes.
In the second set of experiments described hereafter, the granular-shaped polymers were used. The granules are of millimetric size (average 4 mm) and have random forms probably due to their production method by grinding. These granules were used to study the effect of DBD plasma treatment on the tribo-electric properties of polymers. The granular shaped polymers made the tribo-charge much easier using a simple vibrating system. The acquired tribo-electric charge was measured by pouring them immediately after charging into a Faraday pail linked to an electrometer.
2.2 DBD system
The schematic representation of the experimental set up is shown in Figure 1. A high voltage power amplifier (Trek model 30/20 A) was used to energize the active electrode of the DBD cell by a voltage (VDBD) up to 30 kV, at a frequency (f) up to 2.5 kHz. The amplitude and the frequency were adjusted using a function generator (Yokogawa FG300) to drive the power amplifier. All the experiments were carried out with an AC square waveform applied voltage, having an amplitude of 30 kV and a frequency of 800 Hz. These settings were justified by the fact that a preliminary test have shown that the DBD discharge covers all the electrodes gap for this frequency but has a more localized filamentary aspect beyond this threshold (Fig. 2). This situation should be avoided because the treatment would not be homogenous [14,38,39].
The applied voltage was measured via the internal probe monitor system of the power amplifier with a conversion ratio of 1/3000 V and the discharge current was measured by using a non-inductive resistor (100 Ω) placed between the bottom electrode and the ground. The waveforms were visualized and recorded by means of a digital oscilloscope (Lecroy Waveace 1001). A spark gap were used to protect the oscilloscope measurement channel.
 |
Fig. 1 The DBD experimental setup schematic representation. (1) DBD cell, (2) HV power amplifier, (3) function generator, (4) current measurement channel, (5) non-inductive resistor of 100 Ω, (6) voltage measurement channel, (7) oscilloscope, (8) spark gap protection. |
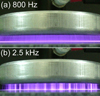 |
Fig. 2 Photography of the DBD for frequency of (a) 800 Hz and (b) 2.5 kHz; applied voltage amplitude: VDBD = 30 kV. |
2.3 DBD treatment of polymer slabs
The DBD cell (Fig. 3) is composed of two parallel aluminium discs (7.5 cm in diameter). The upper active electrode was made mobile and could be moved up and down to change the discharge gap. The dielectric barrier consists of a square glass plate, 15 × 15 cm, with a thickness ed = 3 mm. The polymer slabs were cut from a sheet of ep = 5 mm of thickness into 15 × 15 cm plates and were inserted in the discharge gap for treatment. The inter-electrodes distance was set at d = 11 mm for all the experiments. All polymer slabs samples were cleaned, rinsed with distilled water and dried in ambient air before exposure to DBD plasma. Drying of the samples in an oven at a temperature below the melting temperature of the polymer may also be carried out in order to minimize the amount of residual water on the sample's surface. This protocol will ensure a very homogeneous surface modification.
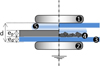 |
Fig. 3 Experimental setup for DBD treatment. (1) Active electrode, (2) grounded electrode, (3) dielectric barrier (glass), (4) polymer sample (granules or slab), (5) plasma. |
2.3.1 Fourier-transform infrared (FTIR) spectroscopy
The infrared spectrometer (Shimadzu FTIR IRAffinity-1S miracle-10) were used to analyze the surface chemical composition before and after exposure to DBD plasma. A reproducibility test was performed and it showed that the absorbance spectrum measurement is reproducible on the entire treated area of each sample. However, small variations were observed for samples having different histories. To avoid this, the choice of samples must be given special attention and samples must come from the same source.
2.3.2 Optical profilometer
The 3D Non-Contact Surface Profiler System (Talysurf CCI 6000) was used for scanning the surface of the treated samples and determining the surface roughness. The manufacturer software (Mountain map7) was used to analyze the data. The scanning was repeated three times in different areas for each treated sample. The polymers surface analysis was performed for several different air DBD exposure durations.
2.4 DBD treatment of polymer granules
The granules were treated by means of the same DBD cell; see the symmetry axis right side of Figure 3; the dielectric barrier consist of two square glass plates of 15 × 15 cm with the thickness ed = 3 mm. The polymer granules samples (mass m = 10 g) were inserted in the discharge gap for treatment and the inter-electrodes distance was also set at d = 11 mm. The deposition of the granules was carried out with great care, to obtain a quasi mono-layer of almost constant thickness. The granules have been arranged in a mono-layer in the inter-electrodes space so that they can all be exposed to the plasma. Since this mono-layer is not similar to a polymer slab, the plasma has become in this case non-diffuse (a much-localized filamentary DBD character due to the spacing between the granules). To obtain a diffuse discharge, a dielectric barrier was added under the active electrode. Thereby, the total thickness of the dielectric became larger and the localized filamentary character disappeared. This diffuse DBD plasma allowed covering a large part of the surface of the granules.
2.5 Tribo-charging system
After treatment of the 10 g quantity of the polymer granules with the DBD plasma, they were placed in a tribo-charging system. The latter was composed of a cylindrical in shape PP container with a diameter of 14 cm and a height of 20 cm, this latter is mounted on a vibrating plate of a Sieve Shaker (Retsch model); the granules acquired an electrostatic charge by rubbing with the container walls. The container dimensions are enough appropriate to allow the granule/wall impact predominance. The tribo-charging duration was set by means of the vibrating system timer to 2 min.
After tribo-charging, the granules were placed in a Faraday pail connected to an electrometer (Keithley, model 6514) that measured their total electric charge. The measurements were repeated three times. Compressed air was used to clean the PP container and an electrostatic neutralizer (model ELCOWA ECA 88 BS) was used between each measurement to neutralize the residual electrical charges.
3 Results and discussion
3.1 DBD treatment
To study the effect of plasma exposure on the three polymer samples, the energy per period of the DBD was evaluated by using the voltage and current oscillograms. Figure 4 shows a typical example of voltage and current waveforms recorded during the treatment of a polymer slab. From these oscillograms, it can be seen that the discharge current is constituted by many current pulses (magnitude up to 90 mA) occurring during the positive and the negative transitions of the applied voltage. This indicates that the DBD operates in a filamentary regime. Similar current waveforms have been obtained in the cases of PE and PVC.
The energy per period provided by the DBD was calculated in post processing by integrating the instantaneous power over a complete period. Figure 5 shows the variation of the energy as a function of the treated polymer type. The energy is higher in the case of PVC sample due to the fact that its relative dielectric permittivity (3.1–4.4) is higher in comparison with PE (2.2–2.4) and PP (2.1–2.3). This means that the polymer DBD treatment depends not only on the parameters of the high-voltage supply but also on the nature of the sample interposed between the electrodes and acting as a secondary dielectric barrier. As consequence of this type of treatment, the provided energy should be regulated in relation with the kind of the treated polymer [40].
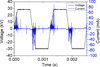 |
Fig. 4 Typical current and voltage waveforms of DBD, in the case of polypropylene treatment, VDBD = 30 kV, f = 800 Hz. |
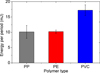 |
Fig. 5 DBD energy per period depending on the nature of treated polymer, for VDBD = 30 kV, f = 800 Hz. |
3.2 Surface profile analysis
Figure 6 shows the variation of the average value of the surface roughness Sa for the three types of polymer slabs (PP, PE, and PVC) as a function of the exposure time. After 25 min of exposure to the DBD, the PVC starts to degrade and emit smoke. Therefore, the exposure was limited to 30 min for PP and PE. The standard deviation bars are so small that they are covered by the dots in the graph, which indicates that DBD treatment is well homogeneous. The significant increase in the surface roughness can be assigned to the polymer surface etching by the air DBD plasma.
The roughness change differs from one polymer to another due to their different chemical properties. For example, in the case of PP the average surface roughness is multiplied by 18 when treated for 30 min and only by 1.9 for PE.
Figure 7 shows the 3D profile of the untreated and 15 min treated polymer slabs. Before the treatment, the materials presented relatively flat surfaces with some reliefs due to the rolling manufacturing method. After plasma exposure, it can be observed an etching effect over the treated surface resulting in a small nodules formation, which is in agreement with previous reports [4,10,35].
During the experiments, we found that in the case of long exposure times, the surface of PVC samples started to deform and melt. This is because the DBD provides more energy when the treated polymer is PVC (see Fig. 5). The increase in roughness may be saturated or stopped by the increase in temperature at the surface of the polymer through partial melting. This result confirms that the plasma surface modification and the amount of the provided energy depend also on the kind of polymer to be treated.
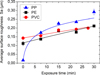 |
Fig. 6 Average surface roughness versus exposure time. (a) Polypropylene, (b) polyethylene, (c) polyvinyl chloride, for VDBD = 30 kV, f = 800 Hz, square waveform. |
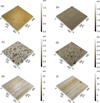 |
Fig. 7 3D images reconstituted by profilometry in the case of (a) untreated PP, (b) treated PP, (c) untreated PE, (d) treated PE, (e) untreated PVC, and (f) treated PVC, for VDBD = 30 kV, f = 800 Hz, square waveform, exposure time = 15 min. |
3.3 FTIR analysis
The FTIR spectra changed with the exposure time as shown in Figure 8. With increasing the exposure time, new peaks emerged for all the three types of polymers. In the case of PP sample, the peaks at 1717 cm−1 and 1647 cm−1 correspond to carbonyl C═O stretching vibrations and the broad peak at 3178 cm−1 is ascribed to OH group vibration. As all the new bonds are related to oxygen, it can be concluded that DBD is responsible for oxygen grafting (from the air) to the polymer surface [21,41]. The same changes were also observed for PE sample but with smaller absorbance amplitude. In the case of PVC, the same changes as PP occurred except that the untreated samples displayed already a carbonyl absorption at 1732 cm−1, which can be attributed to a partial oxidation during manufacturing or the existence of a plasticizer in the polymer.
The typical characteristics of the absorbance bands are summarized with their corresponding wave numbers in Table 1. The results indicate that the increase in the exposure time for PP and PE samples is followed by an increase in the absorbance peaks of the C═O and the OH group, while those of the CH bands (CH3 as, CH2 as, CH3 sy, CH2 sy) are decreasing. This confirms that there is a molecular etching leading to a substitution of the hydrogen present in the polymer structure with oxygen. The emergence of OH group is attributed to the absorbed water at the sample surface. In fact, it is known in most cases that exposure to plasma makes the polymer surface hydrophilic and allows it to absorb water vapor either from the air or from the chemical reaction between the plasma and the DBD [41]. The increase in the absorbance peak of the grafted oxygen group (C═O) has a saturation phase. The saturation is due to the etching that tends to deplete the surface grafted polar groups and leads to a dynamic equilibrium between the two processes of grafting and etching [21,35,41]. The PVC is a particular case because of its relative sensitivity to the heat produced by the DBD (see Fig. 5) and the presence of the carbonyl group in the untreated samples, which can explain the slight deviation of the PVC data from the expected results.
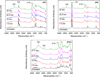 |
Fig. 8 FTIR spectrum changes versus exposure time. Conditions: VDBD = 30 kV, f = 800 Hz, square waveform. |
3.4 Tribo-charge measurement
Figure 9 shows the variation of the tribo-electric charge acquired by the granules as a function of their DBD exposure times.
The short exposure time to DBD plasma improved the tribo-charging of the granules, whereas the long exposure times had an inverse effect, i.e. the polymer could not be charged by tribo-electric effect and became antistatic. This observation is very interesting, because DBD treatment for short times can be used in applications where there is a need to improve tribo-charging, such as in the case of the electrostatic separation of granular plastic wastes in the recycling industry [43,44]; while long time treatment can be used for protection against electrostatic hazard since the treated polymer become antistatic [45–47].
The explanation of this behavior is related to the fact that the DBD plasma exposure increases the roughness of the sample surface and also increases its wettability by grafting polar group such as the carbonyl (C═O), see Figures 6 and 8. Indeed for short times DBD exposure, the increase in roughness help to create charge traps at the surface of the polymer; this observation is explained by the fact that the increase in roughness lead to increase the number of peaks or points at the surface of the granules. According to Neagoe et al. [48], the contact between surfaces is usually made on a number of points related to the surface roughness. When the surfaces is in contact with respect to each other, a point from one of the surfaces may remain in contact with the other surfaces for a while. After a displacement, the contact point will give way to a new one; the more points of contact are the higher and uniform the acquired tribo-electric charge is. On the other hand, the increase in wettability becomes very effective in long times treatment and will lead to increase the surface conductivity of the granules by absorbing moisture (this was confirmed by the presence of OH group from the water on the slabs samples, see Table 1). Therefore, as the exposure time to the DBD increases, the surface of the granules becomes more and more conductive and will no longer keep the tribo-charge. Thereby, it will be very difficult or impossible to tribo-charge the long times treated granules even if the roughness is also increased.
This double aspect of DBD treatment in the air can explain the contradiction in the works of Murata et al. [31] and Changqi et al. [32]. Indeed Murata et al. treated the PS for a very short duration in their powder injection system (with a volumetric flow of 4 × 10⁻⁴ m3/min) before sending it to the friction charger. Doing this, they have enhanced the frictional charge. On the contrary, Chongqi et al. have decreased the ability of tribo-charging by treating the PS for 20 sec, which is much longer time than that of Murata et al.
The data in Figure 9 show that the acquired charge by the untreated PP granules (at t = 0) is very low. This is normal since the container is also made of PP. On the other hand, after exposing the PP granules to DBD for very short times, the acquired charge has been multiplied by a factor of 4. This observation points out the capacity of the DBD to modify the surface state of the polymers and its electrostatic behavior.
The case of PVC is a little different; there is only a slight variation of the tribo-electric charge for short DBD exposure times. The cause is that the PVC starting samples already contains traces of carbonyl polar group and the surface has already a partial hydrophilic and conductive character, which explains why there is not much difference between the acquired tribo-charge for samples with short exposure times and the untreated ones. For DBD long exposure times, there is a significant decrease in the tribo-electric charge. The reason behind this decrease is that the provided energy by the DBD system is too high in the case of PVC treatment (see Fig. 5). Therefore, the surface wettability of the PVC sample (due to polar group grafting) and the increase of its surface conductivity are also much pronounced for long exposure times with respect to PP and PE.
 |
Fig. 9 Granules acquired tribo-charge variation versus DBD exposure time. |
4 Conclusion
In this paper, experimental investigations are carried out on the treatment of polymers by air DBD plasma. The main objective is to evaluate the surface change at the morphological and the chemical levels to explain the tribo-electric properties changes for three types of polymers (PP, PE and PVC). The parameter of the study is the exposure time.
The main results of this work can be summarized as follows:
-
the supplied energy by the DBD plasma varies depending on the type of the sample. In fact, as the sample to be treated is inserted in the discharge gap it behaves as a dielectric barrier and influences its own plasma treatment;
-
after DBD exposure, the surface roughness increases by etching effect for all types of polymers with different rates. However, the roughness change can be stopped by the increase in the temperature and the partial melting of the surface, as in PVC case;
-
the FTIR analysis showed that the exposure to the air DBD plasma results in a dissociation of the CH bond and a grafting of polar groups (C═O) at the polymers surface. The latter modification is responsible for increasing the wettability of the samples by the absorption of moisture, as confirmed by the presence of the broad peak of OH in all the treated polymers;
-
the effect of the air DBD treatment of the polymer can be summed up into change in roughness (increase in the contacts points) and change in wettability (increase in the surface conductivity). This combination of changes influences the behavior of the treated polymer during tribo-electric charging. In other words, the roughness helps to increase the number of contact points at the sample surface and the tribo-charging ability, while the wettability does the opposite by increasing the surface conductivity of the granules as well as speeding of loss and dispersion of the tribo-charge;
-
DBD exposure acts in two manners on the tribo-charging of granular polymers. For short time treatment, the tribo-charge can be enhanced and for long time treatment, the tribo-charge is diminished or even annealed.
The studies of surface modification for electrostatic properties should continue, to achieve a better understanding of the nature of the induced changes and their interactions with the tribo-charging phenomena.
Further investigations are planned to evaluate the effect of DBD treatment on the surface resistivity. The effects of several other factors must be further studied, such as the type of the container material on which friction occurs. The use of cooling and regulation of the plasma electric power and the nature of the plasma itself according to each type of polymer will also be taken into consideration.
Acknowledgment
The author M.F Bekkara would like to express his gratitude to all the members of the Angoulême laboratory team (Karim Medles, Bogdan Neagoe, Yopa Prawatya, Gontran Richard and Sara Messal) for their scientific and technical assistance, as well as to the Algerian government for financing his stay at the IUT of Angoulême (program PNE 2015-2016).
References
- A.W. Rory, Plastic Surface Modification, Surface Treatment, Decoration, and Adhesion (Hanser Publishers/Hanser Publications, Munich/Cincinnati, 2010) [Google Scholar]
- P. Fabbri, M. Messori, Modification of Polymer Properties, edited by C.F. Jasso-Gastinel, J.M. Kenny, (William Andrew Applied science publishers, 2017) [Google Scholar]
- C. Borcia, G. Borcia, N. Dumitrascu, Appl. Phys. A: Mater. Sci. Process. 90, 507 (2008) [CrossRef] [Google Scholar]
- A. Mercado-Cabreraa, B. Jaramillo-Sierra, R. López-Callejas, R. Valencia-Alvarado, A. de la Piedad-Beneitez, R. Pena-Eguiluz, S. Barocio-Delgado, A. Munoz-Castro, B. Rodríguez-Méndez, Prog. Org. Coat. 76, 1858 (2013) [CrossRef] [Google Scholar]
- P. Cools, S. Van Vrekhem, N. De Geyter, R. Morent, Thin Solid Films 572, 251 (2014) [Google Scholar]
- M. Šimor, Y. Creyghton, A. Wypkema, J. Zemek, J. Adhes. Sci. Technol. 24, 77 (2010) [Google Scholar]
- T. Govindarajan, R. Shandas, Polymers 6, 2309 (2014) [Google Scholar]
- Z. Zhang, Surface modification by plasma polymerization and application of plasma polymers as biomaterials, Ph.D. Thesis, Department of Chemistry and Pharmacy Of the Johannes Gutenberg University, Mainz, 2003 [Google Scholar]
- Z. Fang, X. Wang, R. Shao, Y. Qiu, K. Edmund, J. Electrostat. 69, 60 (2011) [Google Scholar]
- L. Dascalescu, An introduction to ionized gases, theory and applications (Toyohashi University of Technology, Japan, 1993) [Google Scholar]
- N. Takahashi, A. Goldman, M. Goldman, J. Rault, J. Electrostat. 50, 49 (2000) [Google Scholar]
- F. Massines, G. Gouda, N. Gherardi, M. Duran, E. Croquesel, Plasmas Polym. 6, 35 (2001) [CrossRef] [Google Scholar]
- F. Massines, G. Gouda, J. Phys. D: Appl. Phys. 31, 3411 (1998) [CrossRef] [Google Scholar]
- P. Bruggeman, R. Brandenburg, J. Phys. D: Appl. Phys. 46, 1 (2013) [Google Scholar]
- A.N. Bhoj, M.J. Kushner, J. Phys. D: Appl. Phys. 40, 6953 (2007) [CrossRef] [Google Scholar]
- M. Šíra, D. Trunec, P. Sťahel, V. Buršíkovà, Z. Navràtil, J. Buršík, J. Phys. D: Appl. Phys. 38, 621 (2005) [CrossRef] [Google Scholar]
- J. Niu, D. Liu, J. Chen, H. Ding, Y. Wu, Eur. Phys. J. Appl. Phys. 57, 10801 (2012) [CrossRef] [EDP Sciences] [Google Scholar]
- M. Cernak, L. Cernakov, I. Hudec, D. Kovacik, A. Zahoranova, Eur. Phys. J. Appl. Phys. 47, 22806 (2009) [CrossRef] [EDP Sciences] [Google Scholar]
- M. Thomas, K.L. Mittal, Atmospheric pressure plasma treatment of polymers relevance to adhesion (Scrivener Publishing LLC Wiley, Beverly Ma, 2013) [CrossRef] [Google Scholar]
- H. Rauscher, M. Perucca, G. Buyle, Plasma technology for hyperfunctional surfaces (Wiley-VCH Verlag GmbH and Co.KGaA, Weinheim, 2010) [CrossRef] [Google Scholar]
- C.S. Ren, K. Wang, Q.Y. Nie, D.Z. Wang, S.H. Guo, Appl. Surf. Sci. 255, 3421 (2008) [Google Scholar]
- H. Zhang, H. Li, M. Fang, Z. Wang, L. Sang, L. Yang, Q. Chen, Appl. Surf. Sci. 388, 539 (2015) [Google Scholar]
- K.G. Kostov, A.L.R. dos Santos, R.Y. Honda, P.A.P. Nascente, M.E. Kayama, M.A. Algatti, R.P. Mota, Surf. Coat. Technol. 204, 3064 (2010) [Google Scholar]
- Z. Niu, C. Zhang, T. Shao, Z. Fang, Y. Yu, P. Yan, Surf. Coat. Technol. 228, 578 (2013) [Google Scholar]
- R. Sharma, S. Trigwell, M.K. Mazumder, R.A. Sims, in Polymer surface modification: relevance to adhesion, edited by. K.L. Mittal (Vol 3 VSP Utrecht, Boston, 2004) [Google Scholar]
- R. Sharma, S. Trigwell, M.K. Mazumder, Part. Sci. Technol. 26, 587 (2008) [CrossRef] [Google Scholar]
- R. Sharma, R.A. Sims, M.K. Mazumder, J. Ark. Acad. Sci. 56, 157 (2002) [Google Scholar]
- K. Takashima, T. Oda, J. Electrostat. 46, 193 (1999) [Google Scholar]
- H. Takeda, Y. Murata, Jpn. J. Appl. Phys. 35, 4791 (1996) [Google Scholar]
- J. Kodama, R. Forerch, N.S. McIntyre, G.S.P. Castle, J. Appl. Phys. 74, 4026 (1993) [Google Scholar]
- Y. Murata, Y. Hara, in Proceedings of 36th IEEE-IAS Ann. Meeting, Vol. 2, Rome, Italy, 2000, p. 847 [Google Scholar]
- M. Chongqi, Z. Shulin, H. Gu, J. Electrostat. 68, 111 (2010) [Google Scholar]
- F. Massines, P. Ségur, N. Gherardi, C. Khamphan, A. Ricard, Surf. Coat. Technol. 174–175, 8 (2003) [Google Scholar]
- M.F. Bekkara, Y. Benmimoun, A. Tilmatine, K. Miloudi, S. Flazi, J. Electrostat. 88, 225 (2017) [Google Scholar]
- Z. Fang, X. Xie, J. Li, H. Yang, Y. Qiu, E. Kuffel, J. Phys. D: Appl. Phys. 42, 1 (2009) [Google Scholar]
- A.C. Aba'a Ndong, N. Zouzou, N. Benard, E. Moreau, J. Electrostat. 71, 246 (2013) [Google Scholar]
- J. Jolibois, N. Zouzou, E. Moreau, J.M. Tatibouët, J. Electrostat. 69, 522 (2011) [Google Scholar]
- R.B. Tyata, D.P. Subedi, Kathmandu Univ. J. Sci. Eng. Technol. 6, 96 (2010) [Google Scholar]
- F. Massines, N. Gherardi, N. Naudé, P. Ségur, Eur. Phys. J. Appl. Phys. 47, 22805 (2009) [CrossRef] [EDP Sciences] [Google Scholar]
- D.E. Ashpis, M.C. Laun, E.L. Griebeler, Progress toward accurate measurements of power consumptions of DBD plasma actuators, NASA Center for Aerospace Information 7115 Standard Drive Hanover, MD 21076–1320 (NASA Glenn Research Center, Ohio, USA, 2012) [Google Scholar]
- K.G. Kostov, T.M.C. Nishime, L.R.O. Hein, A. Toth, Surf. Coat. Technol. 234, 60 (2013) [Google Scholar]
- D.W. Mayo, F.A. Miller, R.W. Hannah, Course notes on the interpretation of infrared and Raman spectra (John Wiley & Sons, Inc., New Jersey, 2003) [Google Scholar]
- S. Bendimerad, A. Tilmatine, M. Ziane, L. Dascalescu, Int. J. Environ. Stud. 66, 529 (2009) [Google Scholar]
- M.E. Zelmat, M. Rizouga, A. Tilmatine, K. Medles, M. Miloudi, L. Dascalescu, IEEE Trans. Ind. Appl. 49, 1113 (2013) [Google Scholar]
- T. Zeghloul, A.M. Benhafssa, G. Richard, K. Medles, L. Dascalescu, J. Electrostat. 88 1–5 (2016) [Google Scholar]
- A. Nadjem, M. Kachi, F. Bekkara, K. Medles, T. Zeghloul, L. Dascalescu, J. Electrostat. 86, 18 (2017) [Google Scholar]
- A. Iuga, L. Calin, V. Neamtu, A. Mihalcioiu, L. Dascalescu, J. Electrostat. 63, 937 (2005) [Google Scholar]
- M.B. Neagoe, Y.E. Prawatya, T. Zeghloul, L. Dascalescu, in 13th International Conference on Tribology, ROTRIB'16 (IOP Publishing, IOP Conf. Series: Materials Science and Engineering, 2017), p. 174 [Google Scholar]
Cite this article as: Mohammed Fethi Bekkara, Lucien Dascalescu, Youcef Benmimoun, Thami Zeghloul, Amar Tilmatine, Noureddine Zouzou, Modification of surface characteristic and tribo-electric properties of polymers by DBD plasma in atmospheric air, Eur. Phys. J. Appl. Phys. 81, 10801 (2018)
All Tables
All Figures
|
Fig. 1 The DBD experimental setup schematic representation. (1) DBD cell, (2) HV power amplifier, (3) function generator, (4) current measurement channel, (5) non-inductive resistor of 100 Ω, (6) voltage measurement channel, (7) oscilloscope, (8) spark gap protection. |
| In the text | |
|
Fig. 2 Photography of the DBD for frequency of (a) 800 Hz and (b) 2.5 kHz; applied voltage amplitude: VDBD = 30 kV. |
| In the text | |
|
Fig. 3 Experimental setup for DBD treatment. (1) Active electrode, (2) grounded electrode, (3) dielectric barrier (glass), (4) polymer sample (granules or slab), (5) plasma. |
| In the text | |
|
Fig. 4 Typical current and voltage waveforms of DBD, in the case of polypropylene treatment, VDBD = 30 kV, f = 800 Hz. |
| In the text | |
|
Fig. 5 DBD energy per period depending on the nature of treated polymer, for VDBD = 30 kV, f = 800 Hz. |
| In the text | |
|
Fig. 6 Average surface roughness versus exposure time. (a) Polypropylene, (b) polyethylene, (c) polyvinyl chloride, for VDBD = 30 kV, f = 800 Hz, square waveform. |
| In the text | |
|
Fig. 7 3D images reconstituted by profilometry in the case of (a) untreated PP, (b) treated PP, (c) untreated PE, (d) treated PE, (e) untreated PVC, and (f) treated PVC, for VDBD = 30 kV, f = 800 Hz, square waveform, exposure time = 15 min. |
| In the text | |
|
Fig. 8 FTIR spectrum changes versus exposure time. Conditions: VDBD = 30 kV, f = 800 Hz, square waveform. |
| In the text | |
|
Fig. 9 Granules acquired tribo-charge variation versus DBD exposure time. |
| In the text | |
Current usage metrics show cumulative count of Article Views (full-text article views including HTML views, PDF and ePub downloads, according to the available data) and Abstracts Views on Vision4Press platform.
Data correspond to usage on the plateform after 2015. The current usage metrics is available 48-96 hours after online publication and is updated daily on week days.
Initial download of the metrics may take a while.