| Issue |
Eur. Phys. J. Appl. Phys.
Volume 92, Number 3, December 2020
|
|
|---|---|---|
| Article Number | 30903 | |
| Number of page(s) | 8 | |
| Section | Physics of Energy Transfer, Conversion and Storage | |
| DOI | https://doi.org/10.1051/epjap/2020200228 | |
| Published online | 11 December 2020 | |
https://doi.org/10.1051/epjap/2020200228
Regular Article
A versatile set-up to study plasma/microwave sources for liquid fuel ignition
1
ONERA/DMPE, Université de Toulouse,
31055
Toulouse, France
2
LAPLACE, CNRS, Université de Toulouse,
Toulouse, France
* e-mail: This email address is being protected from spambots. You need JavaScript enabled to view it.
Received:
9
July
2020
Received in final form:
16
October
2020
Accepted:
22
October
2020
Published online: 11 December 2020
Abstract
Motivated by the high demand for an alternative, more reliable, high energy ignition source to facilitate the re-ignition of lean-burn combustion chambers which are necessary to reduce pollutant emissions, a new set-up has been designed to study plasma/microwave sources. The use of a waveguide-based resonant cavity leads to very low power plasma ignition. An example in this paper shows that a plasma at atmospheric pressure can be maintained with less than 2 W input power. Such a performance is possible using the large variety of possible adjustments (resonance frequency, different kind of initiators, etc.) that this versatile set-up offers. To illustrate the wide range of possible studies, another example is given and discussed : minimum ignition energy for an ethanol droplet stream with aluminum and stainless steel initiators. The results show that the initiator material and its surface quality have an influence on the minimum ignition energy, especially for large gaps. Depending on the gap size we can get down to under 10 W entering the cavity to ignite the droplet stream.
© B. Fragge et al., EDP Sciences, 2020
 This is an Open Access article distributed under the terms of the Creative Commons Attribution License (https://creativecommons.org/licenses/by/4.0), which permits unrestricted use, distribution, and reproduction in any medium, provided the original work is properly cited.
1 Introduction
In the aeronautic as well as in the automotive industry, stricter environmental regulations on pollutant emissions from the engines (nitrogen oxides, carbon oxides, unburned hydrocarbons, soot, etc.) lead manufacturers to design more efficient combustors which tend to operate at leaner fuel-air mixtures to reduce fuel consumption and emissions. This may result in severe issues such as combustion instabilities and flame blowout that should be handled carefully to ensure durability and operability of the engine. Concerning gasoline engines, a challenge consists of operating the combustor in a regime where it is in principle the fuel/air mixture cannot burn, by for example using a pre-combustion chamber. Regarding aircrafts or helicopters, in-flight extinction is an additional crucial issue that requires a quick response from the engine, which is rapid altitude relight (in low temperature and pressure environment, −56 °C, 0.2 bar). While in both cases, ignition is realized by means of a conventional spark plug, there has been a constant research over the last fifty years to design innovative igniters with improved capabilities (higher energy, better energy deposition in the flow, etc.).
A highly researched field is plasma ignition, due to its favorable influence on ignition and combustion, such as extended ignition limits and increase of the flame speed. As described in [1], most microwave plasma ignition systems use non-equilibrium plasma. In these plasmas, the electron temperature is much higher than the heavy particle temperature. It is not in thermal equilibrium, like in usual spark plug systems. This high electron temperature leads to a high acceleration of the electrons which enhances energy transfer as well as the creation of radicals via collisions and therefore increases chemical reactivity.
Examples include ignition by means of laser sources [2,3], Radio Frequency (RF) discharges [4,5], DBD [6,7], Nanosecond discharges [8,9] and Microwaves (MW) [10–12] on which we will focus in the present paper.
The first studies concerning the ignition of flammable gases via RF and MW originate from the 1970s and 1980s [11,13,14]. The goal was not the study of engine ignition, but the potential hazard of antennas, emitting microwaves near offshore platforms, where inflammable gases exist. In the internal combustion engine community, the results of microwave plasma having positive effects on flame stability and decreasing the lean ignition limit, led to a wide range of studies on plasma assisted combustion and ignition [15,16]. In the automotive industry, the Quarter-Wave Coaxial Cavity Resonator (QWCCR) [12,17–21] is a technology that has been extensively investigated as a potential new igniter. This coaxial line, short-circuited on one side and open on the other, is capable of creating a plasma at the tip of the inner conductor in air for pressures above 1 bar. In the aeronautical industry there is one very interesting study to name here [10], that operates with a MW Plasma Generator (PG) to create a plasma plume or a surface discharge for ignition. Using this set-up, the authors demonstrate a successful ignition of a kerosene-fueled realistic turbojet combustor (Tfuel = 300 K, Tair = 280 K–570 K, Pair = 0.1 MPa and Mach number of air = 0.08–0.35).
Starting from the idea that developing a new igniter requires the possibility to investigate the influence of various plasma parameters (location, duration, repetition rate, etc.) or different types of fuel/air mixture (gas or liquid), we have designed a versatile MW ignition set-up suitable for various applications. The remaining paper comprises five sections. We first introduce the background and motivation of this study and then describe the experimental apparatus and instrumentation used. The MW cavity and plasma are subsequently characterized and ignition results on a droplet stream of ethanol are presented with a focus on the minimum ignition energy needed with our newly-developed plasma source. The paper ends with a summary of the main findings and perspectives.
2 Background and motivation
The objective of this study is to design an experimental set-up, based on a microwave cavity, in which we are capable of accurately managing the electric field in order to create plasma breakdown in air at ambient conditions (T ≈ 20 °C, p = 1 bar), at a controlled position (in the gap between the two initiators). Thanks to this controlled and repeatable plasma location, it is possible to use an academic liquid fuel injection system to study parametrically droplet ignition via this MW Plasma.
Using a standard metallic cavity with a resonance frequency around 2.45 GHz, we can benefit from a high quality factor Q and remain in the low microwave power range of only a few 100 W instead of kW, that are typical of experiments in the archived literature. It makes it easier to have a safe set-up either for persons in charge of the experiments or for surrounding instrumentation sensitive to electromagnetic hazards.
The drawback with such a microwave cavity is that it only operates at a specific frequency which may drift with time (temperature change in the room, heating of the cavity due to plasma, geometric changes inside the cavity, etc.). As a consequence, the microwave source needs to be accurately tuned and the cavity dimensions needs to be adaptable for the very sensitive resonance frequency, when different configurations of initiators are tested. Taking account of these different constraints, we have designed a versatile set-up to investigate the use of microwaves for plasma generation applied to droplet ignition, which, we believe, extend the possibilities of studies in that field compared to what has been previously published in the literature.
3 Experimental test rig
In this section, we describe the experimental test rig, designed to achieve the goals mentioned before. We begin with the electromagnetic cavity design and then the fuel injection system used.
3.1 The cavity
The cavity is an aluminium (AU4G 2017A) parallepipedic square-box with a microwave resonant frequency around 2.45 GHz. It is used with electromagnetic resonant mode TE012 [22] which is the second one, increasing in frequency. The choice of this specific mode is related to the cavity length and it produces a standing wave with two maxima in the electric field along the x-axis, the longitudinal direction. One maximum allows to feed the cavity with good matching. In this area the head of the N-type coaxial connector is located. At the other maximum the initiators and the gap are placed, which enables us to focus and enhance the electric field: in this way, the plasma is repeatedly localized in the gap zone, see Figure 1.
The accurate shape design relies on 3D electromagnetic simulations performed with the HFSS solver (ANSYS) using a Finite Element Method (FEM). The computations account for aluminium walls, the presence of a coaxial feeding and initiators inside the cavity. The feeding wave port has been placed to inject the microwaves into the calculation volume. The coaxial connector consists of an inner conductor made of copper wrapped in PTFE.
In Figure 2, one can see the magnitude plot of the electric field in the vertical median plane of the cavity. The coaxial connector has been placed a bit off of the first maximum. This is a trade-off between a good matching (i.e. power transfer to the cavity), and the avoidance of a high field at the inner conductor which could lead to parasitic breakdown and plasma creation andtherefore damage and destruction of the connector, especially the PTFE around. Figure 1 shows the final cavity.
For conducting various tests, several Degrees Of Freedom (DOF) are available. First of all, we can change the length of the cavity to adjust the resonance frequency by moving its side plates. Secondly, we can change the penetration of the coaxial connector into the cavity to achieve a better matching. To define a good matching, the reflection coefficient S11 has to be ≤ −10 dB (i.e. 90% power transfer). Lastly, we have different shapes of initiators, see Figure 3, as the shape of the initiator influences the plasma creation. The initiators (1) and (2) are cylindrical. (1) exhibits a flat head and (2) a spherical head. These two initiators have a 4 mm hole along their own cylindrical axis, to inject the fuel through them if needed. They create a fixed gap of ~4 mm. The initiators (3R) and (3L) are truncated aluminum cones with very small upper diameters of 583 μm and 385 μm, respectively.They are screwed in flanges and by removing them, the gap can be changed. Initiator (4) is a threaded bold of stainless steel that has been ground to tips on one side. These last ones only can be screwed so that we achieve an adjustable gap that can be changed even during experiments.
As seen in the literature [21], we need an electric field density of the order of E = 777 to 1800 kV/m to reach breakdown in air at ambient conditions. With numerical simulation with an input power of 100 W, as seen in Figure 2, we checked that initiators (1) and (2) reach this order of magnitude in electric field density (V/m) in the gap between the initiators, prior to manufacturing of the cavity and the initiators.
All of the tests have been done under atmospheric conditions in air. The holes of the cavity are not larger than d = 6 mm. Thus, they are small enough to not let the microwaves at f0 = 2.45 GHz go through metallic walls and to limit the radiation losses.
Another particularity that makes this set-up so versatile is, that the flanges for the initiators and the fuel injection are interchangeable, allowing to easily permute the configuration of the cavity as can be seen in Figure 4. As the whole cavity is a screwed construction, all six plates are easily exchanged or altered. For the present work, we have used, for example, closed side plates with only a small hole for visualization as well as a side plate with a grid of 30 × 30 mm for a larger view.
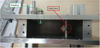 |
Fig. 1 Photoof the present aluminum cavity with coaxial connector and cylindrical initiators with spherical head. |
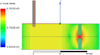 |
Fig. 2 Simulation results of electric field in the vertical median plane of the cavity for an input power of 100 W. The red zone between the initiators corresponds to a highly concentrated electric field. |
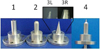 |
Fig. 3 The initiators tested: (1) cylindrical with flat head, (2) cylindrical with spherical head, (3R) and (3L) aluminum cones and (4) tips in stainless steel. |
3.2 Liquid fuel injection system
The injection system used is a mono-disperse droplet generator (MDG). It creates a mono-disperse droplet stream [23] in the upward vertical direction. The MDG creates a droplet stream using a piezoelectric ceramic, fed with a frequency generator (fpiezo ≈ 16 kHz). The resulting droplet size depends on the velocity of the liquid v, the diameter of the diaphragm hole D at the injector exit and the excitation frequency fpiezo. It can be determinded as follows [23]
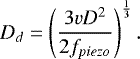 (1)
(1)
As v and fpiezo are held constant, the droplet size can be modified by changing the size of the diaphragm hole. In this work we used a diaphragm with a hole of D = 150 μm. Measurements have shown that the theoretical value for Dd is around 5% lower than the measured value. These measurements have been conducted in a similar environment with a shadowgraphy set-up and a telecentric lens. For our experiments, the measurement defined the droplet size for D = 150 μm as Dd = 289 μm. The stability of the droplet stream is controlled via a shadowgraphy set-up that is described in the following section. Moreover, the relative pressure on the fuel is a very sensitive and important parameter that influences strongly the power needed for fuel ignition. It is held constant at a relative pressure of prel = 0.8 bar.
4 Instrumentation
Figure 4 shows a sketch of the experimental set-up without the shadowgraphy part since it is only used temporarily, at the beginning of a run. The instrumentation set consists of a camera, a spectrometer and a microwave monitoring system, located around the microwave cavity and the feeding system. As mentioned above, the direction of the fuel injection can be changed. In Figure 4 in the configuration I, the fuel is injected perpendicular to the initiator axis. In the configuration II the fuel is injected along the initiator axis, which is only possible with initiators (1) and (2).
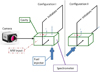 |
Fig. 4 Scheme of experimental set-up. Configuration I: fuel injection perpendicular to initiator axis. Configuration II: fuel injection along initiator axis. |
4.1 Control tools
4.1.1 Shadowgraphy
The shadowgraphy set-up (Fig. 5) has been used to visualize and regulate the droplet stream. The usual set-up for this method relies on a high speed camera and a continuous light source. Since the camera employed has a slow frame rate, we have chosen a stroboscopic light source with a variable duration and frequency of the light pulse. In the present work, the pulse duration is fixed at its minimal value tpulse = 15.2 μs and its frequency adjusted accordingly to the camera frame rate. With this visualization of the droplet stream, we could adjust the excitation frequency of the injector to get a stable stream with droplets of regular size and distance, as seen in the leftmost image of Figure 5. The shadowgraphy permits to control the shape of the droplets, their size is determined by the diaphragm hole and the MDG conditions, as described in Section 3.2.
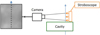 |
Fig. 5 Scheme of the shadowgraphy set-up. |
4.1.2 Spectrometer
The multichannel spectrometer of Avantes enables to measure two wavelength bands at the same time. The optical fiber is fixed at the side wall at the height of the gap to visualize the signature of the plasma. However, measuring slightly above the gap (~10 mm), we can use the spectrometer to visualize successful ignition of the fuel. Looking at the example of ethanol ignition in Figure 6, the presence of the two peaks around the wavelengths λ1 ≈ 431 nm and λ2 ≈ 516 nm, relative respective to the excitation of CH and C2 molecules, are typical of an ethanol flame.
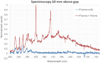 |
Fig. 6 Spectroscopic results for ethanol ignition. |
4.1.3 Temperature measurements
The temperature in the cavity (close to the initiators) has been measured with a thermocouple before and after each experiment. With these measurements we could ensure the same conditions for each experiment and let the cavity cool down between two ignition tests if necessary.
4.2 Measurement tools
4.2.1 Microwave system
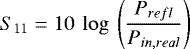
Figure 7 shows a scheme of the microwave feeding and monitoring circuit. The microwave system consists of a Sairem solid-state microwave generator Model GMS200W. The frequency can be accurately tuned with a 100 kHz step in a bandwidth from 2.43 to 2.47 GHz. The maximum output power is 200 W, it can be set with a 1 W resolution. At its output, a circulator protects the generator from any reflected power, which is redirected in a matched load. After the circulator, abidirectional coupler and two MARCONI power meters are installed to monitor incoming and reflected powers. Subtracting the losses of the coaxial cables, we can determine the actual injected and reflected powers at the head of the coaxial connector at the cavity input. From these values, we can deduce the reflection coefficient S11, defined as follows:
 (2)
(2)
with Pin,real the incoming power and Prefl the reflected power at the cavity entry.
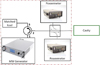 |
Fig. 7 Description of the microwave feeding and monitoring system. |
4.2.2 Camera
The camera is an IDS monochrome camera (model UI-5040SE Rev. 4) equipped with a 75 mm fixed focal length lens (DG series from Edmund Optics). It has an image frequency of 73 fps at full resolution (1448 × 1086 pixels). The camera has been used for visualization of the interior of the cavity during experiments and for shadowgraphy (see Sect. 4.1.1).
The main purpose of the camera is to determine if there is a plasma discharge between the initiators or not. Further, we can visualize the form and the change of the plasma between the initiators as one can see in Figure 9.
4.2.3 Vector-Network-Analyzer
We used a Vector-Network-Analyzer (VNA) to measure the resonance frequency f0 as well as the adaptation in form of the reflection coefficient S11. Further, we can determine the quality factor Q from the resonance diagram determined with the VNA. This electromagnetic characterisation is detailed in the next section.
5 Electromagnetic characterisation of the set-up
In this section, we present some experimental results of the electromagnetic characterisation of the cavity and the microwave plasma created inside.
5.1 Cavity quality factors for all initiators
We have first tested several initiators to determine the related resonance frequencies and quality factors Q with a Vector-Network-Analyzer E5071C (VNA) of Keysight. The resonance frequency is very sensitive to changes in geometry. As our cavity has movable side plates to change the cavity length, we can adapt the cavity to reach a resonance frequency around 2.45 GHz (i.e. in the generator bandwidth) for all initiators. The Q factor is defined as follows:
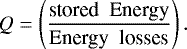 (3)
(3)
It can be easily derived from the frequency variation of the reflection at the cavity input. To calculate its exact value, we used a resonance diagram, see Figure 8, and the following equation:
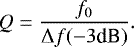 (4)
(4)
Table 1 shows the Q-factors for our cavity for all initiators. They are twice to ten times higher than in the previously cited microwave studies [18,21]. This results in less input power needed to reach the electric field for breakdown between the initiators.
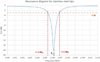 |
Fig. 8 Example of resonance diagram for the calculation of the Q factor. |
Q factors for different initiators
5.2 Minimum power for plasma creation and conservation
We used thealuminum cones (3) to study another interesting point: the measurement of the minimal input power to create the plasma and the minimal power to maintain it. These initiators were chosen as they allow a good repeatability compared to (1) and (2) and a higher Q factor (therefore a larger amount of energy stored in the cavity) compared to (4). We tested the aluminum cones at a large gap of 2.09 mm. At these conditions we are able to create a plasma at a minimum power of Pcav = 68.2 W and it is possible to maintain it down to Pcav= 1.51 W. We can see the change in the form of the plasma from discharge between the two initiators to two spheres, one attached to each tip and finally to only one sphere with decreasing power in Figure 9a. The minimal power Pcav is the effective power entering the cavity, which is calculated as follows:
 (5)
(5)
It has to be mentioned that the creation of plasma leads to a mismatching of the cavity. Starting with a S11 ≤ −10 dB, it jumps to ~-3 dB at the moment of plasma creation. For the rest of the paper, the power Pcav in equation (5) is calculatedwith the Prefl after plasmacreation.
6 Example study of ethanol ignition
One of the great advantages of the set-up presented in this paper is its versatility and in consequence a large number of possible studies. In this chapter we present one example study to illustrate one possibility out of many.
In this section we present the study of ethanol ignition with a microwave plasma, created between different initiators. First, the creation of plasma has been studied, before continuing with the ignition tests of an ethanol droplet stream. This pre-study has shown, that the initiators (3) and (4) are the most reliable in plasma creation and therefore favorable for ignition tests. This is the reason why further in the study we only mention these two initiators.
The results presented are only examples of the possible studies with this set-up and not a full list.
6.1 Plasma creation for ignition tests
At first and as expected, the experimental observations demonstrate that the geometry of the initiators and the gap distance have a major influence on the creation of a plasma and its shape.
For instance, with the flat head initiators (1), no plasma is observed, whatever the value of the input power with the generator used (Pin ≤ 200 W). A possible explanation is due to the absence of any sharp edges for this initiator geometry conversely to the other ones. It should also be mentioned that for the cylindrical initiators (1), (2), the gap between them was fixed to ~4 mm. This decision was made due to a compromise for experiments where the droplets were injected through these initiators (see Fig. 4 configuration II) and their passage in the cavity restricted to this gap size. On one hand, a smaller gap increases the electric field density, but on the other hand, a larger gap permits a longer resident time of the droplet in the cavity and therefore leads to more ignitable vapor. However, in the subsequent experiments (mostly with (3) and (4) initiators) the droplet stream was vertical and thus perpendicular to the initiator axis, as shown in Figure 4 configuration I. Therefore, the droplets resident time in the cavity was long and independent of the gap size. With the cones (3) and tips (4) we were able to change the gap size (cones: 0 to 5 mm; tips: 0 to 4 mm) and therefore increase the density of the electric field to reach breakdown.
Using the initiators with a spherical head (2), the presence of a plasma is not systematical. At powers high enough to create a plasma, it is always located on only one of the initiators and, more precisely, on the edge of its inner hole. Furthermore, the plasma may be located on any of the two initiators.
With the aluminium cones (3R), (3L) we observed that depending on the input power the shape of the plasma could be changed. As shown in Figure 9a, a plasma arc appears between the cones at high power. Reducing this power leads to a separation of the arc into two spheres, one at each cone. Decreasing the power further down, yields the plasma on the less sharp cone (3R) to extinguish; and the plasma on the sharper cone (3L) extinguishes at even lower power.
With the stainless steel tips (4), we can create a plasma arc (see Fig. 9b), but it extinguishes directly when reducing the power without the transition of separate plasma spheres. This can be due to several reasons: the material of the tips (the conductivity of stainless steel is ~30 times smaller than that of aluminium), their surface quality and the form of the tips. To determine the influence of these properties an exhaustive study is necessary, which is not part of this work.
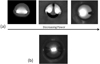 |
Fig. 9 Plasma between initiators: (a) aluminum cones, (b) stainless steel tips. |
6.2 Ignition tests
One of the most interesting parameters in ignition studies is the minimum power needed to ignite the fuel / air mixture. However, this energy depends on several parameters such as air temperature, pressure, fuel type, local flow velocity, turbulence, etc.. Additionally, for liquid fuels, other parameters like fuel temperature, droplet size and velocity, play a role in the droplet evaporation process, which ultimately conditions the amount of fuel vapor released in the flow and the ignitability. In the following, we present the minimum power needed to ignite the monodisperse stream of ethanol droplets with a diameter of 289 μm.
For the ignition tests, we created the plasma at 200 W, before reducing the power to the power tested. Once at theright power level, the ethanol droplet stream was injected and the measurements done. In Table 2 the experimental conditions and the power meter measurements of the real power arriving Pin,real and reflecting Prefl at the cavity entry are shown for several ignition tests.
Figure 10 shows the dependence of the minimum power Pcav on the gap size between the different initiators. It also shows the influence of the initiator material. The diagram shows the error bars regarding the power measurements as well. We can see that the uncertainties are very low. With our power-meters we can measure theincident and reflected power with a very good precision.
If we take the data set of the stainless steel initiators in Figure 10, we can see the tendency of an optimal gap size (minimum ignition energy) around the gap = 1.1 mm. It has been shown by other researchers (e.g. [24]) that the optimal gap size is called quenching distance dq. At the gap size dq, the heat delivered in the kernel volume for ignition just exceeds the heat losses to the surrounding medium. For gaps smaller than dq the heat losses increase and to overcome them for successful ignition we need more energy, ergo the minimum ignition energy increases. For gaps larger than dq, the kernel volume increases and therefore more energy is needed to heat up the whole volume to ignition temperature.
However, if we look at the data set for the aluminium cones, we can not see this tendency for an optimal gap size. The values of the minimum ignition energy for smaller gaps (≤ 1.3 mm) are all around Pcav ≈ 10 W. This observation can be due to the geometry of the aluminium cones. As we can see in Figure 11, the initiators are not perfectly truncated cones. As they are screwed into the construction more or less far to get the different gap sizes, it can not be guaranteed that they face each other in the exact same way for all experiments. This little change in geometry can have an important influence on the focused field and as a consequence, on the minimum ignition energy.
If we compare now the two data sets, we observe the large difference between the minimum ignition energies at larger gaps. With the stainless steel tips we need almost two times more energy to ignite the same ethanol droplets than with the aluminum cones. This difference can be due to the difference in material and shape of the initiators. On one hand, we have a higher electric conductivityand a larger amount of energy stored in the cavity (higher Q) for the aluminum cones. On the other hand, the presence of sharp edges plays an important role for the intensity of the electric field. Even if the stainless steel tips are sharpened, the edges of the truncated aluminum cones also lead to an increase in electric field density and therefore allow the lower Pcav needed for ignition.
As mentioned at the beginning of this chapter, the presented results are only an example of a possible study with this set-up. The given explanations for the observations shown are possible reasons. To determine in which way and to what extend these explanations play their role in the presented study, a more exhaustive work is necessary, which is not part of this paper.
Example of experimental conditions with plasma between the initiators for successful fuel ignition tests.
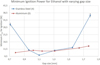 |
Fig. 10 Minimum ignition power for different initiators for ethanol. |
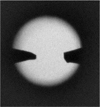 |
Fig. 11 Aluminium cones in experiment. |
7 Conclusion
We showed in this paper a new, versatile set-up of a resonant cavity to study low power plasma/microwave sources for liquid fuel ignition. With this set-up we have a great freedom regarding the sensitive resonance frequency, the matching between the cavity and the excitation, the form of the focusing geometry as well as the direction and form of fuel injection. This set-up gives a wide range of possible studies, of which the one shown and discussed in this paper is only a fraction.
To profit a maximum from this set-up, the ignition study can be extended to more different gap sizes and new initiator shapes and materials. Additionally, studies as the ignition of kerosene and the influence of droplet size will be realised as well. This set-up will also help to design a larger, more ambitious set-up that allows the work on fuel sprays and wider electromagnetic studies.
Author contribution statement
All the authors were involved in the preparation of the manuscript. All the authors have read and approved the final manuscript.
Acknowledgements
This experimental work has been financially supported by the foundation STAE. Further, we thank Geoffroy Illac of ONERA and Olivier Pigaglio of the laboratory Laplace for their technical support during this work.
References
- Z. Wang, Y. Wang, L. Zhu, W. Ma, J. Shan, F. Liu, IEEE Access 7, 23951 (2019) [CrossRef] [Google Scholar]
- J.X. Ma, D.R. Alexander, D.E. Poulain, Combust. Flame 112, 492 (1998) [CrossRef] [Google Scholar]
- G. Kroupa, M. Börner, in International Conference on Space Optics-ICSO 2018 (International Society for Optics and Photonics, 2019), Vol. 11180, p. 111805I [Google Scholar]
- G. Discepoli, V. Cruccolini, F. Ricci, A. Di Giuseppe, S. Papi, C. Grimaldi, Appl. Energy 263, 114617 (2020) [CrossRef] [Google Scholar]
- F. Auzas, Ph.D. thesis, Paris 11 (2008) [Google Scholar]
- U. Kogelschatz, B. Eliasson, W. Egli, Le J. Phys. IV 7, C4 (1997) [Google Scholar]
- J. Deng, C. Peng, L. He, S. Wang, J. Yu, B. Zhao, J. Thermal Sci. 28, 1035 (2019) [CrossRef] [Google Scholar]
- S. Lovascio, J. Hayashi, S. Stepanyan, G.D. Stancu, C.O. Laux, Proc. Combust. Inst. 37, 5553 (2019) [CrossRef] [Google Scholar]
- S.V. Pancheshnyi, D.A. Lacoste, A. Bourdon, C.O. Laux, IEEE Trans. Plasma Sci. 34, 2478 (2006) [CrossRef] [Google Scholar]
- A.M. Davydov, S.I. Gritsinin, I.A. Kossyi, Y.M. Shikhman, V.A. Vinogradov, IEEE Trans. Plasma Sci. 36, 2909 (2008) [CrossRef] [Google Scholar]
- S. Ghobrial, M. Verma, D. Howson, Radio Electr. Eng. 46, 64 (1976) [CrossRef] [Google Scholar]
- J. Wilhelm, F. Pertl, P. Willdfire, J. Smith, in 39th Plasmadynamics and Lasers Conference (2008), p. 3775 [Google Scholar]
- D. Burstow, R. Loveland, R. Tomlinson, D. Widginton, Radio Electr. Eng. 51, 151 (1981) [CrossRef] [Google Scholar]
- P. Excell, IEE Proc. A 131, 103 (1984) [CrossRef] [Google Scholar]
- S.M. Starikovskaia, J. Phys. D 39, R265 (2006) [Google Scholar]
- A. Starikovskiy, N. Aleksandrov, Progr. Energy Combust. Sci. 39, 61 (2013) [CrossRef] [Google Scholar]
- K. Linkenheil, H.O. Ruoß, T. Grau, J. Seidel, W. Heinrich, IEEE Trans. Plasma Sci. 33, 1696 (2005) [CrossRef] [Google Scholar]
- F. Pertl, J. Smith, Proc. Inst. Mech. Eng. D 223, 1405 (2009) [CrossRef] [Google Scholar]
- F.A. Pertl, M.A. Clarke, J.E. Smith, Int. J. Microwave Wireless Technolog. 3, 485 (2011) [CrossRef] [Google Scholar]
- C. Stevens, F. Pertl, J. Hoke, F. Schauer, J. Smith, Proc. Inst. Mech. Eng. D 225, 1633 (2011) [CrossRef] [Google Scholar]
- J. von Hagen, Y. Venot, Y. Zhang, W. Wiesbeck, IEEE Trans. Plasma Sci. 29, 604 (2001) [CrossRef] [Google Scholar]
- J.D. Jackson, in Classical electrodynamics John Wiley & Sons. Inc., New York, 1999, vol. 13., pp. 246–247 [Google Scholar]
- R.N. Berglund, B.Y. Liu, Environ. Sci. Technol. 7, 147 (1973) [CrossRef] [Google Scholar]
- D. Ballal, A. Lefebvre, Combust. Flame 35, 155 (1979) [CrossRef] [Google Scholar]
Cite this article as: Beatrice Fragge, Jérôme Sokoloff, Olivier Rouzaud, Olivier Pascal, Mikael Orain, A versatile set-up to study plasma/microwave sources for liquid fuel ignition, Eur. Phys. J. Appl. Phys. 92, 30903 (2020)
All Tables
Example of experimental conditions with plasma between the initiators for successful fuel ignition tests.
All Figures
|
Fig. 1 Photoof the present aluminum cavity with coaxial connector and cylindrical initiators with spherical head. |
| In the text | |
|
Fig. 2 Simulation results of electric field in the vertical median plane of the cavity for an input power of 100 W. The red zone between the initiators corresponds to a highly concentrated electric field. |
| In the text | |
|
Fig. 3 The initiators tested: (1) cylindrical with flat head, (2) cylindrical with spherical head, (3R) and (3L) aluminum cones and (4) tips in stainless steel. |
| In the text | |
|
Fig. 4 Scheme of experimental set-up. Configuration I: fuel injection perpendicular to initiator axis. Configuration II: fuel injection along initiator axis. |
| In the text | |
|
Fig. 5 Scheme of the shadowgraphy set-up. |
| In the text | |
|
Fig. 6 Spectroscopic results for ethanol ignition. |
| In the text | |
|
Fig. 7 Description of the microwave feeding and monitoring system. |
| In the text | |
|
Fig. 8 Example of resonance diagram for the calculation of the Q factor. |
| In the text | |
|
Fig. 9 Plasma between initiators: (a) aluminum cones, (b) stainless steel tips. |
| In the text | |
|
Fig. 10 Minimum ignition power for different initiators for ethanol. |
| In the text | |
|
Fig. 11 Aluminium cones in experiment. |
| In the text | |
Current usage metrics show cumulative count of Article Views (full-text article views including HTML views, PDF and ePub downloads, according to the available data) and Abstracts Views on Vision4Press platform.
Data correspond to usage on the plateform after 2015. The current usage metrics is available 48-96 hours after online publication and is updated daily on week days.
Initial download of the metrics may take a while.