Open Access
Fig. 2
Download original image
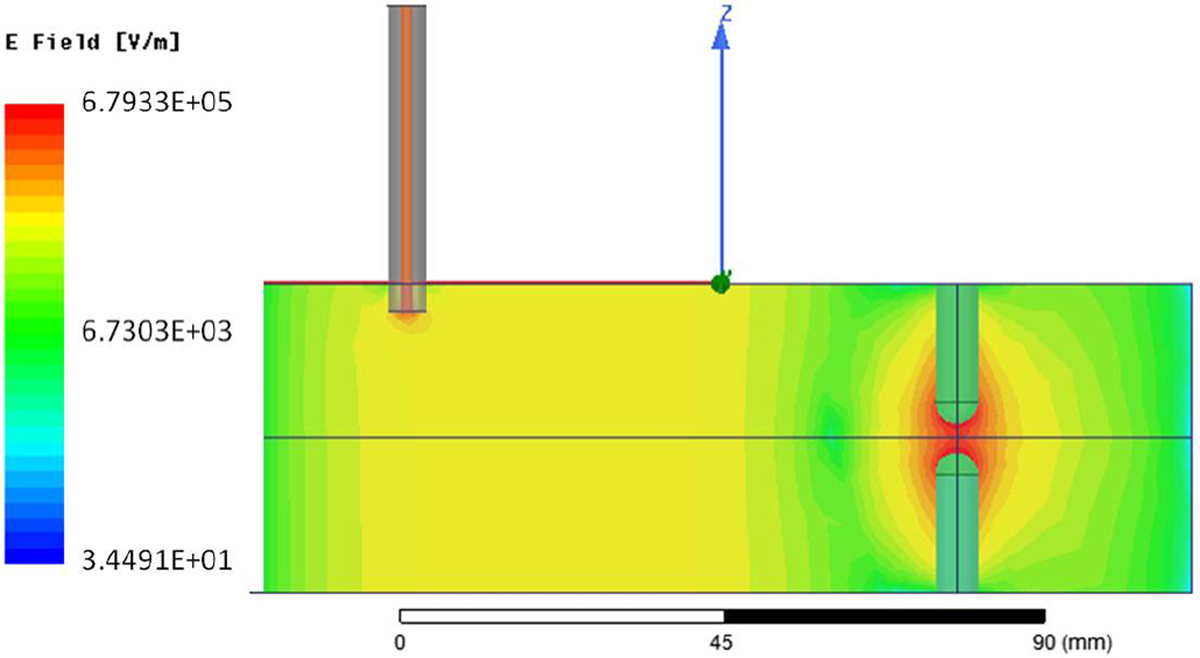
Simulation results of electric field in the vertical median plane of the cavity for an input power of 100 W. The red zone between the initiators corresponds to a highly concentrated electric field.
Current usage metrics show cumulative count of Article Views (full-text article views including HTML views, PDF and ePub downloads, according to the available data) and Abstracts Views on Vision4Press platform.
Data correspond to usage on the plateform after 2015. The current usage metrics is available 48-96 hours after online publication and is updated daily on week days.
Initial download of the metrics may take a while.