| Issue |
Eur. Phys. J. Appl. Phys.
Volume 80, Number 3, December 2017
|
|
|---|---|---|
| Article Number | 30303 | |
| Number of page(s) | 7 | |
| Section | Thin Films | |
| DOI | https://doi.org/10.1051/epjap/2017170314 | |
| Published online | 30 January 2018 | |
https://doi.org/10.1051/epjap/2017170314
Research Article
Tuning the growth and strain relaxation of ferroelectric BaTiO3 thin films on SrRuO3 electrode: influence on electrical properties
1
Centre de Nanosciences et de Nanotechnologies, CNRS, Univ. Paris-Sud, Université Paris-Saclay,
C2N – Orsay,
91405
Orsay, France
2
Laboratoire de Physique des Couches Minces et Matériaux pour l'Electronique (LPC2ME), Univ d'Oran1, Ahmed Ben Bella,
Oran, Algeria
* e-mail: This email address is being protected from spambots. You need JavaScript enabled to view it.
Received:
29
October
2011
Received in final form:
12
November
2017
Accepted:
5
December
2017
Published online: 30 January 2018
Abstract
This study is focused on the link between the structural and electric properties of BaTiO3 thin films grown on SrRuO3-buffered (001) SrTiO3 substrates, SrRuO3 acting as bottom electrode. The growth regime and film structure are here tuned through the growth pressure for pulsed laser deposition in the 1–200 mTorr range. The dielectric, ferroelectric and leakage current properties are systematically measured for the different strain states of the BaTiO3 thin films on SrRuO3. The results are discussed with the help of ab initio calculations on the effects of Ba- and Ti-vacancies on BaTiO3 lattice parameters. A sharp increase of the dielectric constant is evidenced in the high pressure region, where the tetragonality of the BaTiO3 is decreasing rapidly with growth pressure. We interpret this divergence of the dielectric function as the signature of the vicinity of the phase boundary between the out-of-plane and in-plane orientations of the tetragonal BTO films.
© EDP Sciences, 2017
1 Introduction
Barium titanate or BTO (BaTiO3) is widely encountered both in experimental and theoretical works because of its ferroelectric properties, allowing its use in many applications. Among them are ferroelectric tunnel junctions [1,2], non volatile ferroelectric random access memories [3,4], microwave devices [5–7], and thin film optical waveguide modulators [8,9]. A key issue for the integration of epitaxial oxide thin films in general, and of ferroelectric BTO layers in particular, is the strong influence of the growth parameters on the physical properties. In the case of pulsed laser deposition (PLD) [10] of BTO thin films, with oxygen used as background gas, it has been reported that oxygen pressure [11–15] but also laser fluence and substrate temperature [16,17] all have a big impact on the structural and ferroelectric properties of the films. Using X-ray diffraction (XRD), [12] evidenced for BTO thin films deposited directly on a SrTiO3 (STO) substrate a transition, upon increasing the growth pressure, from the so-called c-axis orientation of the tetragonal phase (with the BTO c-axis = [001]BTO aligned along the surface normal) to the a-axis orientation (with the BTO a-axis = [100]BTO along the surface normal, and the c-axis lying in-plane). This change of growth orientation is also observed on a MgO substrate [15]. However, when an epitaxial SrRuO3 (SRO) metallic electrode is inserted between the insulating STO substrate and the BTO ferroelectric layer, the latter is then always found c-axis-oriented [11], even after growth at the high oxygen pressure of 230 mTorr [18]. Still, both tetragonality (c/a ratio) and out-of-plane lattice parameter (c, with a the in-plane one) do decrease with increasing oxygen pressure during growth of BTO on SRO/STO [11]. This observation is usually traced back to a variation of the Ba/Ti cation ratio, due to oxygen pressure or laser fluence affecting the plasma (plume) dynamics, and to its effect on the lattice parameters [11,16]. Indeed, it was shown for BTO by Gonzalo et al [13,19] that the gas pressure during PLD affect the Ba/Ti ratio through mass-dependent scattering processes between the ablation plume species and the background gas. An optimum growth pressure is typically found in the 10–100 mTorr range [11,14], depending on the experimental setup and the target-substrate distance, and ascribed to the obtention of stoichiometric BTO layers.
On the one hand, it has been evidenced that a cation non-stoichiometry of the order of 1% can already modify the strain relaxation of a BTO layer [16], and that there is a direct correlation between Ba/Ti ratio and c lattice parameter [11,16]. On the other hand, it is known that interfacial layers [20], point and extended defects [11], or the vicinity of a strain-driven transition of the polarization orientation [21] are key elements to interpret the ferroelectric, dielectric and leakage current properties. The control of these properties is thus experimentally challenging, and in particular the interplay between stoichiometry, strain relaxation and growth has to be explicitly considered.
In this work, we have chosen the background gas pressure during PLD as handle to tune the Ba/Ti cation ratio and the strain state of BTO thin films deposited on SRO-buffered STO. The structural and electrical properties of the BTO/SRO heterostructures were systematically investigated as a function of oxygen pressure. In order to disentangle the influence of non-stoichiometry from the one of growth kinetics on BTO lattice parameters, we have performed ab initio calculations to estimate the former in the case of Ba or Ti vacancies. Based on distinctive strain-relaxation mechanisms evidenced from XRD and atomic force microscopy (AFM) data, we distinguish between a low pressure (1–10 mTorr) and a high pressure (100–200 mTorr) growth regime. Focusing on the latter, we are able to link the dielectric properties with the strain relaxation of the BTO layer.
2 Experimental details
The (001) BTO/SRO bilayers were deposited on single-crystalline STO (001) substrates by PLD. A KrF excimer laser (λ = 248 nm, fluence 3 J/cm2, 4 Hz repetition rate) was used to ablate stoichiometric ceramic targets of SRO and BTO with spot sizes of 1.8 mm2 and 1.2 mm2, respectively. Target-substrate distance is fixed at 5 cm. The 50 nm-thick SRO electrode layer was first grown on STO at 650 °C under an oxygen pressure of 120 mTorr, and the BTO layer was then deposited at the same temperature with a fixed thickness of 70 nm and an oxygen pressure chosen between 1 mTorr and 200 mTorr. The fully strained SRO film takes an out-of-plane lattice parameter cSRO = 3.95 Å with the same in-plane parameter as the cubic STO substrate (aSTO = 3.905 Å). In bulk form, BTO is tetragonal at room temperature (aBTO = 3.994 Å, cBTO = 4.038 Å) and cubic (aBTOcubic = 4.01 Å) above the Curie temperature. In thin film form, when deposited on SRO/STO, it is tetragonal with a strain relaxation depending on the oxygen pressure, as shown in the Results section. After growth, the temperature was decreased slowly to room temperature under 300 Torr of pure oxygen, to insure stoichiometric oxygen content. AFM (Innova, Bruker) was used to image, in contact mode, the surface topography of deposited thin films. XRD scans (PANalytical X'Pert Pro diffractometer in parallel beam configuration) confirmed the epitaxy and crystalline quality of all layers. The thicknesses were measured by X-ray reflectometry on the same instrument.
To manufacture a set of microscale capacitors of different areas (10 × 10–200 ×200 μm2), a 200 nm-thick Pt top electrode was sputter-deposited on the BTO surface with a conventional lift-off process. This parallel-plate capacitor structure, Pt(top)/BTO/SRO(bottom), allows for the characterization of the electrical and dielectric properties of the BTO thin films. Capacitance (C), current (I) and ferroelectric polarization (P) were measured as a function of applied voltage (V) using an impedance-meter (LCR Hightester, Hioki), a sourcemeter (Keithley 2400), and a ferroelectric tester (TF Analyzer 1000, aixACCT), respectively. The voltage bias was applied between top and bottom electrode, and defined so that positive voltage gives an electric field pointing downward.
3 Computational details
First principle calculations within density-functional theory (DFT) were performed using the full potential linearized augmented plane wave (FP-LAPW) method as implemented in the wien2k [22] code. Perdew-Burke-Ernzerhof generalized gradient approximation (PBE-GGA) was used [23], which is based on exchange-correlation energy optimization to calculate the total energy. A supercell of 40 atoms is constructed with 2 × 2 × 2 BTO unit cells, with P4 mm space group in tetragonal structure, with one Ti or Ba atom removed to simulate the effect of Ti or Ba vacancies on the structural properties. The total energy was minimized using a set of 63 k-points in the Brillouin zone equivalent to a 5 × 5 × 5 Monkhorst–Pack [24] grid in the unit cell. The cut-off energy was set at the value of 8 Ry. The self-consistent calculations are considered to be converged when the total energy of the system is stable within 0.1 mRy.
4 Results and discussion
4.1 Structural analysis
Typical XRD θ−2θ scans around the (002) reflection of the BTO/SRO bilayer deposited on STO substrate at different growth pressures are displayed in Figure 1a. No secondary phases are seen on larger scans (not shown), and in particular the pressure-dependent peaks in the 41–45° 2θ range all stem from the structure of the BTO thin film, comprised of several layers. First, the most intense BTO peak at all pressures is ascribed to the relaxed part of the film [16], with a peak position shifting to higher angles when the oxygen pressure increases, in agreement with previous works [11]. Another, more diffuse peak is seen at lower angles for pressures of 14 mTorr and above. This component is ascribed to the strained part of the BTO film [16], being clearer here at 120 mTorr and above. We interpret this signature in the high pressure range (100–200 mTorr) as coming from the presence of two layers in the film, as observed in the transmission electron microscopy study of [25] and confirmed by the X-ray reciprocal space maps (RSM) measured in the present work (see below).
Both at 1 and 14 mTorr, one observes intensity on the low angle side of the relaxed peak, corresponding to lattice expansion in the direction perpendicular to the sample surface. While this is only a diffuse background at 1 mTorr, fringes appear at 14 mTorr between 41° and 44° in 2θ with a fringe spacing getting smaller closer to the (002) Bragg peak of the relaxed BTO layer. These fringes stem from an area of inhomogeneous strain relaxation in the BTO film, a region with expanded lattice spacing probably on the SRO side. The fringe spacing in reciprocal space gives an indication on the extent of this strained area [26], here at the 10 nm scale. This behavior hints at a transition towards the high pressure regime, where the strained layer peak is well defined. We thus identify two growth regimes with distinctive strain-relaxation mechanisms, one in the so-called low pressure range (∼1–10 mTorr) and one in the high pressure range (∼100–200 mTorr), with a transition between the two already started at 14 mTorr.
To further assess the strain relaxation in the BTO film, RSM were recorded around the STO (103) peak. The RSM for the heterostructures with BTO grown in the different regimes are plotted in Figure 1b, confirming the interpretation above with a strained and a relaxed part in the BTO film. The peak associated with the relaxed BTO layer is not aligned vertically with the STO substrate and is always found at different values of both in-plane and out-of-plane parameters [11,16]. This is at variance with the contribution to the XRD signal from the strained BTO, which is aligned at the same in-plane lattice constant as STO (103) on the RSM for 14 and 170 mTorr in Figure 1b. This finding is in agreement with the interpretation suggested by [25] who described a similar picture for epitaxial BTO deposited on a SRO-buffered STO substrate by PLD: Due to several strain relaxation mechanisms, a layered structure of the BTO film is obtained with a strained layer (∼3 nm thick in Ref. [25]) at the interface and a relaxed layer above, incorporating misfit dislocations. It was noted that upon reducing the misfit strain with the substrate, the thickness of this dislocation-free, strained layer should increase [25], similar to what is observed for BTO deposited on GdScO3 with a critical thickness increasing with decreasing lattice mismatch [16]. From the XRD data of Figure 1a, b it is clear that the strained layer is better defined, at the crystallographic level, upon going from 14 mTorr to 200 mTorr, hinting at a thicker and more homogeneous layer between SRO and the relaxed BTO layer. This behavior is consistent with previous work [16,25] and a decreasing misfit strain with increasing growth pressure.
The lattice parameters of the relaxed BTO layer are plotted as a function of growth pressure in Figure 1c. As noted previously, the out-of-plane parameter decreases with increasing oxygen pressure from 1 mTorr to 200 mTorr. On the other hand, the in-plane parameter has a non-monotonous behavior with growth pressure. Nevertheless, the former is here always found greater than the latter, as illustrated through the c/a ratio at the top of Figure 1c, and in agreement with previous studies for BTO grown on SRO/STO [11,18]. The BTO layer is thus c-axis oriented on the whole investigated pressure range. From RSM around STO (002) (not shown), we checked that there was indeed no measurable a-axis orientation even for the highest investigated oxygen pressures.
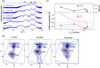 |
Fig. 1 (a) θ−2θ scans of the BTO/SRO/STO heterostructure for the BTO thin films deposited at different oxygen pressures. (b) RSM around the asymmetric STO (103) Bragg reflection of the heterostructure grown at low, intermediate and high oxygen pressure. (c) In-plane (a), out-of-plane (c) lattice parameters and c/a ratio from XRD data of the relaxed BTO layer. Dotted lines are the a and c values of bulk BTO. |
4.2 Growth morphologies
The surface topographies of the BTO thin films were imaged by AFM as presented in Figure 2. The root-mean-square surface roughness (Rrms) was computed from 1 × 1 μm2 images and indicated on top of the topographs, together with the growth pressure. The surface after growth at 170 mTorr was found very similar to the one shown for 200 mTorr. Again, following on the XRD results, two distinct behaviors are identified at low (∼1–10 mTorr) and high (∼100–200 mTorr) pressure, respectively. Here both at 1 and 14 mTorr, the surfaces are smooth with Rrms ∼ 0.5 nm and isotropic islands observed at the 25 nm scale (nearest neighbor distance) on the atomic terraces. Note that with the same growth parameters, a BTO film of the same thickness grown directly on STO, without the SRO electrode layer, has an even smoother surface (Fig. 2, top right), identical to the one found after a so-called layer-by-layer growth mode in [27]. In the high pressure range, the surface roughness has increased to Rrms ∼ 1 nm, and the AFM images show the formation of square islands at the 40 nm scale (Fig. 2, 120 mTorr), coalesced into mesa patterns after growth at 200 mTorr. Increasing the growth pressure thus leads to a coarsened morphology of BTO films [27], in line with the strain relaxation mechanism in this pressure range [25].
 |
Fig. 2 AFM images of BTO surface after growth at different oxygen pressures. The topography after growth of BTO on STO, without the SRO bottom layer, is shown for comparison at 14 mTorr next to the one obtained with SRO layer. |
4.3 Discussing the growth pressure effect on lattice parameters
We now turn to the possible origins of the observed two different growth regimes of BTO films. We note that in the low pressure range, the plume extends up to the substrate, while at high pressure the plume length is smaller than the target-substrate distance and actually does not vary much in the 100–200 mTorr range. Given this difference, coinciding with the aforementioned growth regimes, the pressure-dependent behavior of the energetic species ablated from the target should be considered.
First, the kinetic energy of the particles impinging on the surface is higher at low than at high pressure. In the latter case, when the ablated species reach the substrate they have lost most of their energy, and are transported to the surface by gas phase diffusion [13]. This kinetic effect can also affect the lattice parameters of the growing film, as it modifies the surface diffusion processes and thus the strain relaxation. Second, the different angular spreads of the heavy (Ba) and light (Ti) species in the plume as a function of background gas pressure [28,13] lead to the Ba and Ti excesses observed at low and high pressure, respectively [10,11,13]. This non-stoichiometry then gives a strong variation of the lattice parameters [11,14,16]. With the growth pressure affecting both panels, Ba/Ti ratio and impinging particle energy, further inputs are needed to distinguish between the two effects.
In order to quantify the lattice parameter change with Ba/Ti ratio, we conducted numerical simulations using ab initio calculations. A neutral vacancy was created by removing one atom of Ti in the first case, and one atom of Ba in the second case, corresponding to a vacancy concentration of 12.5% for each case. The calculated lattice parameters are reported in Table 1. As the vacancy concentration is arbitrarily very high, due to computational constraints, the resulting lattice changes for Ti- and Ba-vacancies are to be taken as upper limits.
From ab initio calculations, we found that the lattice parameters of BTO are affected by the Ti and Ba vacancies, in agreement with the available experimental data [11]. The lattice expansion in both out-of-plane and in-plane directions is found much larger in the case of a Ti vacancy than around a Ba vacancy. Thus, Ti vacancies contribute to an increased misfit strain at low pressure (Ba-rich region), and, together with the high kinetic energies in the plume, can explain a more strained layer in this pressure range. In other words, we can not discriminate here between the effects of plume dynamics and Ti vacancies. However, we note that the measured c-parameter for 1 mTorr is much larger than the one calculated for an unrealistically high concentration of Ti vacancies (Tab. 1). The non-stoichiometry alone can thus not explain the lattice expansion in this direction. In addition to the kinetic effect, at this low oxygen pressure a high concentration of oxygen vacancies can be expected [14], which in turn can affect the lattice parameters [29].
In the high pressure range, the (Ti-rich) BTO thin films present a Ba deficiency [11,13]. From our calculations, Ba vacancies induce only a slight change of the in-plane lattice parameter. They can hardly explain the experimental quick drop of the c/a ratio with increasing pressure in the 100–200 mTorr range (Fig. 1c), because the a-parameter indeed increases but with a matching decrease of the c-parameter. Since, as mentioned before, the plume length does not change much in this pressure range, the c/a ratio dropping towards 1 does not seem to stem directly either from the Ba/Ti ratio or from the kinetics in the ablation plasma. Instead, we trace back the drop of the c/a ratio to the vicinity of the transition towards a-axis orientation. This is supported by our XRD data hinting at a decreased in-plane strain in the high pressure range, thus allowing for the film to approach the transition. In this picture, the decrease of the c/a ratio should be concomitant with an increase of the dielectric constant, as the signature of this kind of phase boundary with misfit strain is a diverging dielectric constant [21]. This is indeed confirmed by the dielectric characterizations, as shown in the following part.
Lattice parameters (Å) for bulk BTO from DFT calculations.
4.4 Dielectric characterization
To assess the dielectric properties and ferroelectric character of the samples deposited at different pressures in the 1–200 mTorr range, the capacitance at 100 kHz was measured as a function of the DC voltage bias (V). The results are summarized in Figure 3a. We underline that the BTO films are found ferroelectric over the whole investigated oxygen pressure range (from 1 mTorr to 200 mTorr). It can be seen from our C-V measurements that the capacitance tends to increase with the oxygen pressure [14], especially in the high pressure region, where BTO thin films present a maximum value of capacitance around 17 μF/cm2.
The dielectric constant εr and coercive electric field ΔEc (measured here as peak separation divided by film thickness) are shown in Figure 3b as a function of gas pressure. The dielectric constant was determined from the capacitance measurement, knowing the area of the capacitor in parallel-plane geometry. The dielectric constant varies slightly in the low and intermediate pressure ranges, and exhibits a sharp increase at high pressure to reach a maximum value (εr = 875) at the highest explored pressure of 200 mTorr. The coercive field follows the opposite trend, going down from 140 kV/cm at 1 mTorr to reach 30 kV/cm at 200 mTorr.
In line with the conclusions of the structural analysis, we suggest that the diverging dielectric constant in the high pressure range is the signature of the BTO film approaching the phase boundary between c-axis and a-axis orientations [21]. From studies on BTO ceramics, it is known that a Ti-excess, while the cause of drastic changes of the microstructure, does not impact noticeably the dielectric properties of BTO grains [30]. On the other hand, a similar growth pressure dependence was found for the dielectric properties of epitaxial BTO films on LaNiO3/STO [14], and an increasing dielectric constant when the c/a ratio tends to 1 was reported for polycrystalline, highly textured BTO films on MgO [15]. To further check our interpretation, we compare in Figure 3b the values of the dielectric constant at the maximum applied voltage of 4 V with that measured at the coercive voltage. Far from the ferroelectric switching peak, the dielectric constant shows a much smaller variation with pressure (less than 25%) than the one around the coercive voltages (about 250%). The pressure thus mostly affects the non-linear, ferroelectric part of the permittivity. This supports the picture of a diverging dielectric constant, reminiscent of a Curie-Weiss law [21], approaching the critical strain (in the high pressure range) for in-plane polarization.
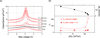 |
Fig. 3 (a) Capacitance measured at 100 kHz as a function of applied bias on BTO films grown at different oxygen pressures. Curves at P = 14–200 mTorr have been shifted (2 μF/cm2 shift between data sets) for clarity. (b) Variation with oxygen pressure (pO2) of the coercive electric field (top panel) and of the dielectric constant at the maximum of C-V curve (squares) and at maximum applied voltage (triangles). |
4.5 Ferroelectric polarization
As a change of the oxygen pressure during deposition affects cation stoichiometry and strain relaxation of the BTO layer, a modification of the ferroelectric behavior is expected due to modified charge distributions and ferroelectric domains. In order to confirm that growth pressure affects polarization, we measured P-V for BTO deposited in the different pressure regions. Ferroelectric P-V hysteresis loops have been extracted from voltage sweeps using PUND (Positive Up Negative Down) method. The hysteresis cycles measured by PUND and classic methods, for a BTO thin film grown at 14 mTorr, are displayed in Figure 4a. The shape and magnitude of the loops depend upon the measurement technique. As PUND gives the pure ferroelectric remnant polarization, without the linear relaxation component, the remnant polarization Pr for 14 mTorr film measured by PUND technique is 6.5 μC/cm2, lower than the one measured by classic technique of 10.4 μC/cm2. This is of the same order of magnitude as reported in previous work [11]. The ferroelectric switching peaks are visible in the I-V curves obtained by PUND (Fig. 4b) for BTO grown at all investigated pressures except at the lowest one (1 mTorr).
When the growth pressure is different from 14 mTorr, we see an increasing asymmetric response depending on voltage sign, with a sharper and larger polarization switching peak at negative voltage than at positive voltage. The asymmetry is most pronounced at 120 mTorr, while leakage current becomes an issue at 200 mTorr (Fig. 4b). This asymmetry can come from different positive (down) and negative (up) polarizations due to a strong internal field effect at high oxygen pressure. Crucially, for the films deposited at 1 mTorr, the leakage current is too high to ascertain the ferroelectric polarization (Fig. 4b), and probably does not allow for a stable remnant polarization through the film.
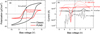 |
Fig. 4 (a) PUND and dynamic (1 kHz) hysteresis loop of BTO thin film grown at 14 mTorr. (b) Pressure dependence of the current response during PUND. |
4.6 Leakage current
For BTO thin film integration in devices, leakage current is an important parameter. For this, we measured I-V characteristics for BTO grown at different pressures as presented in Figure 5. In order to limit the transient contributions to the current due to ferroelectric switching and dielectric relaxation, I-V was measured with a 30 s pre-polarization step at the maximum applied voltage.
There is an important difference between the leakage currents of BTO thin films deposited at different oxygen pressures. A very high current is observed for BTO deposited at low oxygen pressure (1 mTorr). Oxygen deficiency was used as the main reason to explain this observation [31]. At high oxygen pressure, with a close to stoichiometric oxygen content [11,14], we also found that BTO films present high leakage currents, while films grown in the intermediate pressure range (∼10–100 mTorr) achieved very low leakage currents. This illustrates the fact that while non-stoichiometry, whether cation or oxygen, can have a positive effect on structural or dielectric properties, it also drastically increases the leakage current through the films.
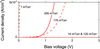 |
Fig. 5 Leakage current as a function of voltage for BTO films grown at different pressures. |
5 Conclusions
Epitaxial BTO thin films were grown on SRO-buffered STO at different oxygen pressures in the 1–200 mTorr range, in order to tune their Ba/Ti cation ratio and strain state. Combining XRD measurements with ab initio calculations, we have studied the strain relaxation and lattice parameter dependence with oxygen pressure. From the structural analysis, we were able to identify two growth regimes, in the low (1–10 mTorr) and high (100–200 mTorr) pressure ranges, respectively. In the former, we can not discriminate between the effects of Ti-vacancies, oxygen content and kinetics of the ablated species, all concurring for a highly strained film. In the high pressure range, we found a decreasing c/a ratio together with an increasing dielectric constant. We suggest that this behavior comes from the vicinity of the strain-driven phase transition between c-axis and a-axis oriented BTO films. While the film was always found c-axis oriented up to 200 mTorr, the decreasing in-plane strain makes it approach the transition upon increasing the growth pressure.
Acknowledgements
This work has been supported by the Tassili Hubert Curien Partnership of Campus France [grant number 13MDU885].
References
- Z. Wen, C. Li, D. Wu, A. Li, N. Ming, Nat. Mater. 12, 617 (2013) [CrossRef] [PubMed] [Google Scholar]
- C. Li, L. Huang, T. Li, W. Lu, X. Qiu, Z. Huang, Z. Liu, S. Zeng, R. Guo, Y. Zhao, K. Zeng, M. Coey, J. Chen, S. Ariando, T. Venkatesan, Nano Lett. 15, 2568 (2015) [CrossRef] [PubMed] [Google Scholar]
- A. Chanthbouala, A. Crassous, V. Garcia, K. Bouzehouane, S. Fusil, X. Moya, J. Allibe, B. Dlubak, J. Grollier, S. Xavier, C. Deranlot, A. Moshar, R. Proksch, N.D. Mathur, M. Bibes, A. Barthélémy, Nat. Nanotechnol. 7, 101 (2011) [CrossRef] [PubMed] [Google Scholar]
- P.R. Evans, X. Zhu, P. Baxter, M. McMillen, J. McPhillips, F.D. Morrison, J.F. Scott, R.J. Pollard, R.M. Bowman, J.M. Gregg, Nano Lett. 7, 1134 (2007) [CrossRef] [PubMed] [Google Scholar]
- M. Liu, C. Ma, G. Collins, J. Liu, C. Chen, A.D. Alemayehu, G. Subramanyam, Y. Ding, J. Chen, C. Dai, Y. Lin, M.W. Cole, Nanoscale Res. Lett. 8, 338 (2013) [CrossRef] [PubMed] [Google Scholar]
- Y.W. Cho, T.S. Hyun, S.K. Choi, J. Electroceramics 13, 251 (2004) [CrossRef] [Google Scholar]
- M.P. McNeal, S.J. Jang, R.E. Newnham, J. Appl. Phys. 83, 3288 (1998) [Google Scholar]
- A. Petraru, J. Schubert, M. Schmid, C. Buchal, Appl. Phys. Lett. 81, 1375 2002 [Google Scholar]
- S. Abel, T. Stöferle, C. Marchiori, C. Rossel, M.D. Rossell, R. Erni, D. Caimi, M. Sousa, A. Chelnokov, B.J. Offrein, J. Fompeyrine, Nat. Commun. 4, 1671 (2013) [CrossRef] [PubMed] [Google Scholar]
- B.D. Chrisey, K.G. Hubler, Pulsed Laser Deposition of Thin Films ( Wiley, New York, 1994) [Google Scholar]
- A.P. Chen, F. Khatkhatay, W. Zhang, C. Jacob, L. Jiao, H. Wang, J. Appl. Phys. 114, 124101 (2013) [Google Scholar]
- C. Li, D. Cui, Y. Zhou, H. Lu, Z. Chen, Appl. Surf. Sci. 136, 173 (1998) [Google Scholar]
- J. Gonzalo, R. Gómez San Román, J. Perrière, C.N. Afonso, R. Pérez Casero, Appl. Phys. A Mater. Sci. Process. 66, 487 (1998) [Google Scholar]
- C.L. Li, Z.H. Chen, Y.L. Zhou, D.F. Cui, J. Phys. Condens. Matter 13, 5261 (2001) [Google Scholar]
- J. Hiltunen, D. Seneviratne, R. Sun, M. Stolfi, H.L. Tuller, J. Lappalainen, V. Lantto, J. Electroceramics 22, 395 (2009) [CrossRef] [Google Scholar]
- D. Kan, Y. Shimakawa, Appl. Phys. Lett. 99, 97 (2011) [Google Scholar]
- G. Radaelli, S. Brivio, I. Fina, R. Bertacco, Appl. Phys. Lett. 100, 102904 (2012) [Google Scholar]
- X.W. Wang, X. Wang, W.J. Gong, Y.Q. Zhang, Y.L. Zhu, Z.J. Wang, Z.D. Zhang, Thin Solid Films 520, 2785 (2012) [Google Scholar]
- J. Gonzalo, C. Afonso, J. Ballesteros, Appl. Surf. Sci. 109–110, 606 (1997) [Google Scholar]
- M. Stengel, N.A. Spaldin, Nature 443, 679 (2006) [CrossRef] [PubMed] [Google Scholar]
- N.a. Pertsev, V.G. Koukhar, R. Waser, S. Hoffmann, Appl. Phys. Lett. 77, 2596, 2000. [Google Scholar]
- P. Blaha, K.S. Luitz, G. Madsen, D. Kvasnicka, J. Luitz, An augmented plane wave plus local orbitals program for calculating crystal properties, WIEN2k, Vol. 2, (2001) [Google Scholar]
- J.P. Perdew, K. Burke, M. Ernzerhof, Phys. Rev. Lett. 77, 3865 (1996) [Google Scholar]
- H.J. Monkhorst, J.D. Pack, Phys. Rev. B 13, 5188 (1976) [Google Scholar]
- J.Q. He, E. Vasco, R. Dittmann, R.H. Wang, Phys. Rev. B 73, 125413 (2006) [Google Scholar]
- N. Sousbie, L. Capello, J. Eymery, F. Rieutord, C. Lagahe, J. Appl. Phys. 99, 1 (2006) [Google Scholar]
- J. Shin, S.V. Kalinin, A.Y. Borisevich, E.W. Plummer, A.P. Baddorf, Appl. Phys. Lett. 91, 1 (2007) [Google Scholar]
- K.L. Saenger, J. Appl. Phys. 70, 5629 (1991) [Google Scholar]
- S.A. Lee, H. Jeong, S. Woo, J-Y. Hwang, S-Y. Choi, S-D. Kim, M. Choi, S. Roh, H. Yu, J. Hwang, S.W. Kim, W.S. Choi, Sci. Rep. 6, 23649 (2017) [Google Scholar]
- J. Lee, K. Hong, J-W. Jang, J. Am. Ceram. Soc. 84, 2001 (2001) [Google Scholar]
- G.Y. Yang, G.D. Lian, E.C. Dickey, C.A. Randall, D.E. Barber, P. Pinceloup, M.A. Henderson, R.A. Hill, J.J. Beeson, D.J. Skamser, J. Appl. Phys. 96, 7500 (2004) [Google Scholar]
Cite this article as: Amina Aidoud, Thomas Maroutian, Sylvia Matzen, Guillaume Agnus, Bouhalouane Amrani, Kouider Driss-Khodja, Pascal Aubert, Philippe Lecoeur, Tuning the growth and strain relaxation of ferroelectric BaTiO3 thin films on SrRuO3 electrode: influence on electrical properties, Eur. Phys. J. Appl. Phys. 80, 30303 (2017)
All Tables
All Figures
|
Fig. 1 (a) θ−2θ scans of the BTO/SRO/STO heterostructure for the BTO thin films deposited at different oxygen pressures. (b) RSM around the asymmetric STO (103) Bragg reflection of the heterostructure grown at low, intermediate and high oxygen pressure. (c) In-plane (a), out-of-plane (c) lattice parameters and c/a ratio from XRD data of the relaxed BTO layer. Dotted lines are the a and c values of bulk BTO. |
| In the text | |
|
Fig. 2 AFM images of BTO surface after growth at different oxygen pressures. The topography after growth of BTO on STO, without the SRO bottom layer, is shown for comparison at 14 mTorr next to the one obtained with SRO layer. |
| In the text | |
|
Fig. 3 (a) Capacitance measured at 100 kHz as a function of applied bias on BTO films grown at different oxygen pressures. Curves at P = 14–200 mTorr have been shifted (2 μF/cm2 shift between data sets) for clarity. (b) Variation with oxygen pressure (pO2) of the coercive electric field (top panel) and of the dielectric constant at the maximum of C-V curve (squares) and at maximum applied voltage (triangles). |
| In the text | |
|
Fig. 4 (a) PUND and dynamic (1 kHz) hysteresis loop of BTO thin film grown at 14 mTorr. (b) Pressure dependence of the current response during PUND. |
| In the text | |
|
Fig. 5 Leakage current as a function of voltage for BTO films grown at different pressures. |
| In the text | |
Current usage metrics show cumulative count of Article Views (full-text article views including HTML views, PDF and ePub downloads, according to the available data) and Abstracts Views on Vision4Press platform.
Data correspond to usage on the plateform after 2015. The current usage metrics is available 48-96 hours after online publication and is updated daily on week days.
Initial download of the metrics may take a while.