Open Access
Fig. 7
Download original image
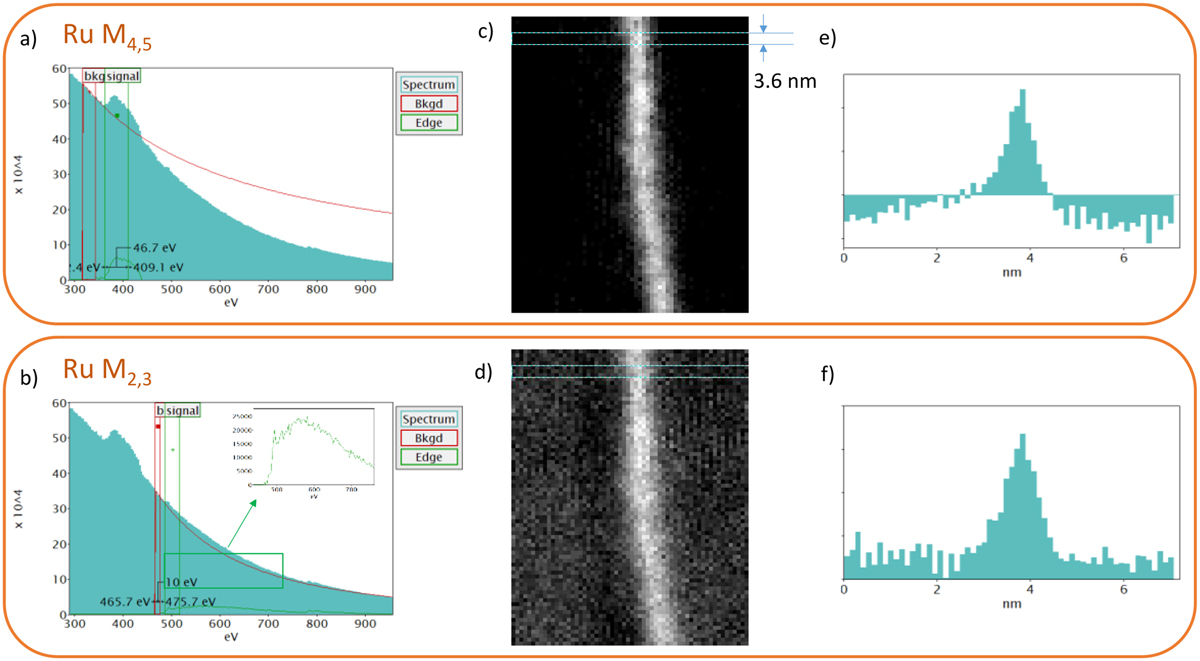
Using the M4,5 edge (a) to map the Ru (c) produces negative values for intensities, as can be seen in the resulting profile (e). The M2,3 edge (b) gives better results (d). On the profile (f) there is an artefact with a small non-zero intensity outside the Ru layer.
Current usage metrics show cumulative count of Article Views (full-text article views including HTML views, PDF and ePub downloads, according to the available data) and Abstracts Views on Vision4Press platform.
Data correspond to usage on the plateform after 2015. The current usage metrics is available 48-96 hours after online publication and is updated daily on week days.
Initial download of the metrics may take a while.