Open Access
Fig. 1
Download original image
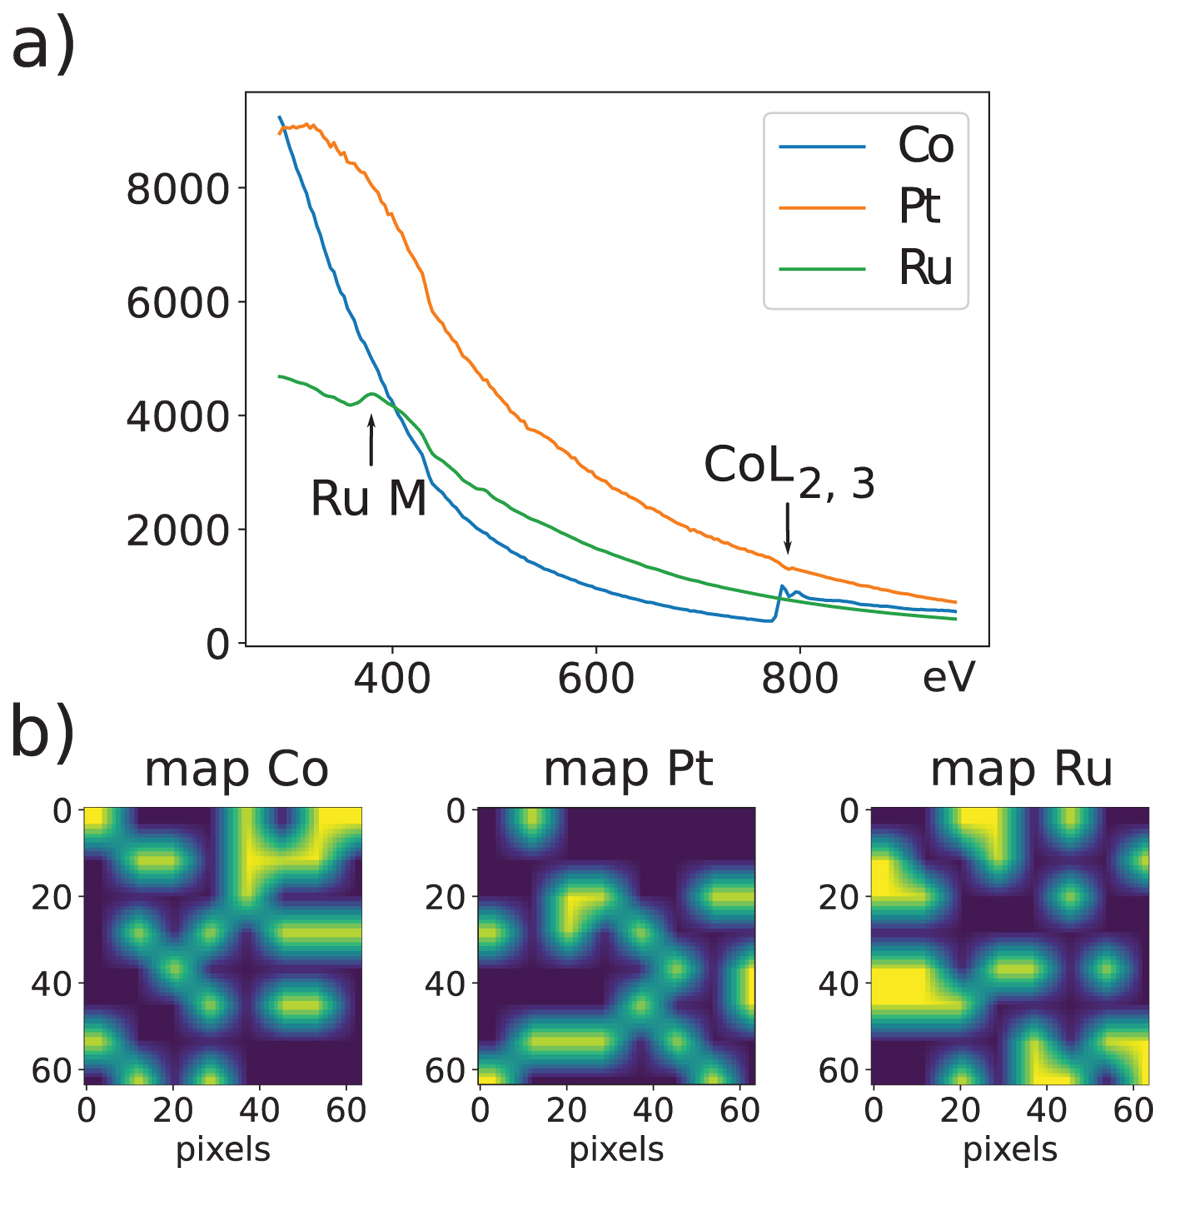
(a) The three components set used to create a synthetic spectrum image − they have been extracted from an experimental dataset, (b)–(d) 64 × 64 maps obtained with the chequerboard model (8 × 8 blocks); each of these maps is associated with one component.
Current usage metrics show cumulative count of Article Views (full-text article views including HTML views, PDF and ePub downloads, according to the available data) and Abstracts Views on Vision4Press platform.
Data correspond to usage on the plateform after 2015. The current usage metrics is available 48-96 hours after online publication and is updated daily on week days.
Initial download of the metrics may take a while.