Open Access
Fig. 6
Download original image
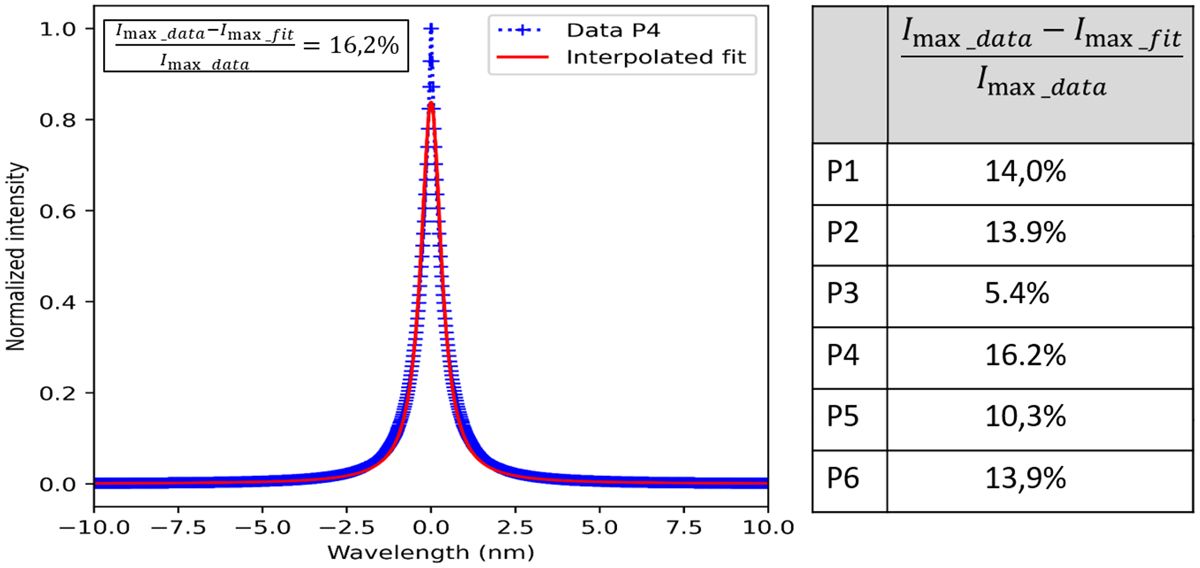
Comparison between the spectral line determined for the temperature profile 4 and its Lorentzian fitted profile (Left side). Table of the error in percentage on the estimation of the maximum for each profile (Right side).
Current usage metrics show cumulative count of Article Views (full-text article views including HTML views, PDF and ePub downloads, according to the available data) and Abstracts Views on Vision4Press platform.
Data correspond to usage on the plateform after 2015. The current usage metrics is available 48-96 hours after online publication and is updated daily on week days.
Initial download of the metrics may take a while.