| Issue |
Eur. Phys. J. Appl. Phys.
Volume 100, 2025
Special Issue on ‘Imaging, Diffraction, and Spectroscopy on the micro/nanoscale (EMC 2024)’, edited by Jakob Birkedal Wagner and Randi Holmestad
|
|
|---|---|---|
| Article Number | 28 | |
| Number of page(s) | 7 | |
| DOI | https://doi.org/10.1051/epjap/2025026 | |
| Published online | 17 October 2025 | |
https://doi.org/10.1051/epjap/2025026
Original Article
Solvent-induced softening of polymethyl methacrylate surfaces studied using atomic force microscopy
Faculty of Science, Technology, Engineering and Mathematics, The Open University, Milton Keynes, MK7 6AA, UK
* e-mail: This email address is being protected from spambots. You need JavaScript enabled to view it.
Received:
15
February
2025
Accepted:
17
September
2025
Published online: 17 October 2025
Abstract
Polymethyl methacrylate (PMMA) is an important plastic in society and museum collections. In heritage collections it is often important to clean and conserve items. Since ethanol is potentially a green solvent with low toxicity, it is of fundamental value to study the interactions between PMMA and ethanol. PMMA is also used extensively for micro- and nanofabrication, for example as a negative photoresist or electron beam resist. Understanding the interaction between PMMA and ethanol at the nanoscale, particularly over extended periods of contact, could yield a deeper understanding of the technologies realizable with this versatile polymer.
Key words: Atomic force microscopy / ethanol / polymethyl methacrylate / topography / Young's modulus
© P. Morfis et al., Published by EDP Sciences, 2025
 This is an Open Access article distributed under the terms of the Creative Commons Attribution License https://creativecommons.org/licenses/by/4.0 which permits unrestricted use, distribution, and reproduction in any medium, provided the original author(s) and source are credited.
1 Introduction
Polymethyl methacrylate (PMMA) is an important plastic in modern art, design and museum collections, having been used since the mid-20th Century for creating artworks [1] but also aircraft cockpit hoods, automotive lighting, jewellery, and optical lenses [2–5]. In heritage collections it is often necessary to clean and conserve items to maintain their visual integrity, enabling their viewing and interpretation as the artist or designer originally intended, as well as maintaining the physical and chemical stability of the materials involved [6]. Plastic items within collections can accumulate surface contamination including oily fingerprints, skin fragments, hair, migrated plasticisers, and carbonaceous dirt [7]. Approaches studied to clean PMMA items range from surface mechanical cleaning with a cloth to the use of solvents or gels [2,3,8]. Currently, there is a drive in heritage and conservation to adopt green cleaning methods, in which ethanol is a suitable low toxicity and low-risk solvent for cleaning surfaces [6,9].
Exposing plastics to solvents is known to alter their surface and sub-surface properties, depending on the extent and duration of exposure [10]. Amorphous plastics are prone to penetration and diffusion by low molecular weight solvents, leading to physical deformation including swelling/plasticization, crazing, cracking, and dissolution [11]. Unwanted or unexpected solid/liquid interactions can irretrievably compromise the visual characteristics of an object were it to be cleaned using an inappropriate method [1]. This is of particular importance to the heritage and conservation sector, who use solvent-based cleaning systems to preserve the appearance of culturally important items over many decades [8]. There is increasing interest in the applicability of nano characterization techniques to inform remedial conservation strategies for plastic items, supporting the preservation of the original intent of the artists and designers [3].
While ethanol is generally classified as a non-solvent for PMMA, recent studies have challenged this assumption. It has been reported that prolonged exposure of PMMA to ethanol can lead to plasticization and changes in surface stiffness [11]. These effects may compromise the long-term stability or appearance of PMMA objects, raising ethical concerns for conservation treatments. There are also other uses for PMMA which would benefit from a deep understanding of its behavior when in contact with solvents such as ethanol. PMMA is a versatile lithographic resist for micro- and nanofabrication processes including photolithography and nano scratching [12,13]. PMMA is widely-used as an electron beam resist, which can be patterned to create lines as narrow as 3 nm across, depending on the molecular weight of the PMMA and the energy of the incident electron beam. According to Hildebrand solubility theory, as PMMA's solubility parameter is 18.7 MPa1/2 and so is more than two units different to ethanol's solubility parameter of 26.2 MPa1/2, PMMA is not expected to dissolve in ethanol [11]. Of note is that ethanol can assist in healing cracks within PMMA samples by immersing the PMMA in ethanol at 40–50 °C, exploiting its ability to diffuse into the polymer matrix and create local softening [14]. Atomic force microscopy (AFM) has previously been used to form 100 nm scale features on the surface of PMMA thin films in alcohol-water mixtures [15]. AFM has also been used to generate craters and ridges on PMMA films, the size of the features being proportional to solvent strength and the applied normal load, while inversely proportional to polymer molecular weight [16]. These findings underscore the need for surface-specific evaluations of PMMA-solvent interactions beyond simple bulk solubility predictions. It is therefore important for the heritage sector and the wider technological field to understand the interaction between PMMA and solvent using well-defined test scenarios.
In this work we report how changes in the PMMA surface during immersion in liquid ethanol manifest optically, spectroscopically, topographically, and mechanically. In particular, we report in situ nanomechanical mapping of the PMMA whilst exposed to liquid ethanol. We believe these results will be of great interest to researchers and technical specialists in fields including conservation, materials science, and nanofabrication, reflecting the myriad uses for PMMA in industry and society in the 21st Century.
2 Material and methods
2.1 Materials
Clear PMMA sheet (The Plastic Shop, UK) of thickness 3.0 mm was cut into squares of 11 mm x 11 mm. Extra pure ethanol (99%+, Fisher Scientific, UK) was used for all immersion studies.
2.2 Immersion tests
The immersion tests were conducted over two durations: 5 h and 48 h. Triplicate samples were each placed vertically into their respective clean glass vial and fully immersed in ethanol. Following immersion, samples were air dried at ambient temperature and humidity (20 °C, 30–50% RH) on borosilicate glass dishes for 24 h inside an extracting fume hood. Subsequently, the samples underwent an additional day of dehydration inside a desiccator containing silica adsorbent.
2.3 Optical microscopy
Images were collected after selected immersion times using a Dino-Lite AM3113T USB 2.0 Digital Microscope.
2.4 Colorimetry
Colorimetry measurements were made using Ci60 portable spectrophotometer (X-Rite, UK) to study any surface color changes. Four measurements were recorded and averaged. Measurements were performed using the CIE (Commission Internationale de l'Éclairage) color space, where specific parameters characterized the color: L* (Lightness) represents brightness, with higher values indicating lighter shades; a* (Red-Green Axis) indicates red hues for positive values and green hues for negative values; b* (Yellow-Blue Axis) indicates yellowish hues for positive values and blue shades for negative values [17,18]. The color difference,  , is calculated according to Equation (1):
 (1)
(1)
2.5 Raman spectroscopy
Raman spectra were obtained using a HORIBA LabRAM HR Evolution system, equipped with a 532 nm laser, 10X lens, a 25% neutral density (ND) filter, and a 600 groove/mm grating. The laser power was attenuated to prevent sample damage. Spectra were collected from multiple regions on each sample, with a focus on areas exhibiting visible changes. A total of five accumulations were performed, each with an acquisition time of 15 s, over the wavenumber range 200 cm⁻1 to 3300 cm⁻1. Data acquisition was performed using LabSpec 6 software, and baseline correction was applied prior to analysis.
2.6 Fourier transform infrared spectroscopy (FTIR)
Fourier Transform Infrared Spectroscopy (FTIR) spectra were obtained using the Attenuated Total Reflectance (ATR) technique. Measurements were performed using a Thermo Nicolet Nexus 670C spectrometer in absorbance mode, with 32 scans per sample and a scan duration of 1.2 s. The spectra were collected over the wavenumber range 4000 cm−1 to 650 cm−1, baseline-corrected and normalized to the 750 cm−1 peak, then processed using OMNIC (Thermo Fisher Scientific). The gain was set at 2, and the wavenumber resolution was set to 4 cm−1 during data acquisition. The spectra were processed using OMNIC software and peaks were normalized to an internal standard vibration of 750 cm−1 [11].
2.7 Atomic force microscopy
Quantitative Imaging measurements were performed using a Bruker NanoWizard V AFM. PPP-NCL cantilevers (Nanosensors, Switzerland) with spring constant approx. 25 N m−1 were used for all measurements. The setpoint compressive normal load was 100 nN, extend speed 65 µm s−1, and pulling length 50 nm. Alongside the height information recorded for every pixel, Young's modulus was calculated using a Hertz model assuming a paraboloid tip shape with 7 nm radius.
3 Results
3.1 Optical microscopy and colorimetry
Visible changes after immersing PMMA in liquid ethanol were difficult to see with the naked eye. Figure 1 shows that the PMMA surface displays some evidence of microscopic morphological changes, often referred to as crazing, after 45 min immersion in liquid ethanol.
Colorimetry measurements over a 120 min period revealed a small yet gradual increase in color difference,  , summarised in Table 1. The
  values are below the value of 1.5 reported after 8,000 h of artificial aging of cast PMMA sheets using a Xe arc lamp in accordance with ISO 4892-2 [19] and remain below the accepted limit of 2.3 under the just-noticeable difference theory [20].
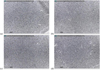 |
Fig. 1 Optical microscope images of the PMMA surface after immersion in liquid ethanol at 20 °C: (a) 0 min; (b) 5 min; (c) 30 min; (d) 45 min. |
PMMA color difference versus time immersed in liquid ethanol at 20 °C.
3.2 Raman and FTIR spectroscopy
Raman spectroscopy (Fig. 2) performed at the surface of the PMMA after 48 h immersion in liquid ethanol did not reveal any discernible change to the material. The sampling depth for a 10X lens (NA 0.25) with 532 nm laser is approximately 8 µm. In comparison, FTIR-ATR exhibits a sampling depth of perhaps 2–3 µm. FTIR spectra (Fig. 3) show the expected peaks for PMMA with C-H stretches at 2985 cm−1, 2945 cm−1, 2918 cm−1, and 2848 cm−1, CO stretches from the ester group at 1722 cm−1, and C-O stretches at 1190 cm−1 and 1142 cm−1.
Comparison of the FTIR spectra acquired before and after ethanol immersion suggests that material may have been leached from the surface into the solvent. This is evidenced by peak intensity reductions at 2918 cm−1 and 2848 cm−1 (Fig. 3 inset), which tend to be associated with C-H stretches in methylene (-CH2-) and methyl (-CH3) moieties. Hence, we suggest that this leached material may be unreacted methyl methacrylate monomer, a hypothesis supported by the decrease in relative intensity of the C-H stretching peaks compared to the C=9552;O and C-O stretching peaks.
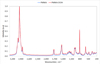 |
Fig. 2 Raman spectra of PMMA before and after 48 h immersion in liquid ethanol at 20 °C. |
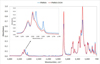 |
Fig. 3 FTIR-ATR spectra of PMMA before and after 48 h immersion in liquid ethanol at 20 °C. |
3.3 Atomic force microscopy
Figure 4a shows the nanoscale topography of the PMMA surface before immersion in liquid ethanol. The surface exhibits an average roughness (Ra) of 2.30 nm and peak-to-valley roughness (Rt) of 37.6 nm. In contrast, the PMMA surface after 120 min immersion in liquid ethanol, Figure 4b exhibits an Ra of 2.49 nm and Rt of 57.1 nm.
Figure 5a reveals that the distribution of moduli measured within the Quantitative Imaging maps becomes increasingly narrow as the surface becomes softer. Figure 5b shows that while the time-dependent surface softening can be approximated as an exponential decrease, the measurements also suggest that a plateau value of mean Young's modulus is reached after immersion times > 60 min.
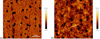 |
Fig. 4 Topography of (a) the unexposed PMMA surface; (b) the PMMA surface after 120 mins immersion in liquid ethanol at 20 °C. |
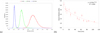 |
Fig. 5 Surface softening of PMMA during immersion in liquid ethanol at 20 °C. (a) Histograms of Young's modulus showing: (i) 5 mins; (ii) 60 mins; (iii) 120 mins; (b) Evolution of Young's modulus during 120 mins immersion. |
4 Discussion
These findings will be of use to heritage and conservation scientists as they suggest caution should be employed when exposing PMMA items to ethanol. Since such exposure can lead to softening of the PMMA, this generates risks for cleaning and conservation activities, particularly if they involve activities which require a second material to slide across the PMMA surface while making contact under a compressive normal load. However, in some situations surface softening may be beneficial, having potential to heal minor cracks. The results also suggest opportunities for developing novel micro- and nanofabrication strategies, whereby a surface which has been temporarily and reversibly softened can be manipulated topographically, for example using nanolithography, nano scratching, or nanoindentation.
While PMMA and ethanol are traditionally considered incompatible according to Hildebrand solubility theory, our findings indicate surface-level interactions between polymer and solvent, suggesting there is a weak affinity between the two [21]. This discrepancy highlights a limitation in using bulk solubility predictions to infer real-world polymer behavior, especially at the micro- and nanoscale. Ethanol has been shown to cause leaching, plasticization, and local mechanical softening, even with polymers considered ‘insoluble’ [11]. Considering the Relative Energy Difference between polymer and solvent, a measure of how dissimilar the solubility parameters are for the two species, PMMA thin films have been shown to swell upon immersion in solvents which were not expected to display a strong affinity for the material [22]. Empirically observed softening and spectral changes suggest that solvent–polymer interactions at the solid/liquid interface may contradict bulk compatibility rules, especially when low molecular weight species or additives are present. While polymer chemists and physicists might be able to study systems ‘from the bottom up’ using high-purity materials of well-understood composition, this is not typically possible for heritage scientists; there is a growing view that surface-specific testing is essential when assessing solvent suitability for conservation applications.
Figure 6 displays an example of a phenomenon observed during the Quantitative Imaging measurements. Quantitative Imaging involves the application of a small normal load at each image pixel, in this case 100 nN. This measurement was performed while the sample was still immersed in ethanol inside the atomic force microscope; the exposure time was approximately 150 min. A previously scanned region of the PMMA surface, when scanned again with the surrounding unscanned material included as comparison, displayed a smaller Young's modulus, suggesting that the physical process of mechanically indenting the surface during the measurement itself causes a change to the polymer orientation. The maximum contact pressure applied to the PMMA surface by the AFM tip is approximately 1.5 GPa; if the surface polymer had become compressed by the indentation, then the Young's modulus would surely be greater than the unscanned surrounding material. Though we are unable to explain this result at the present time and believe it to be an interesting topic for future work, we speculate that solvent has advanced beyond the solid/liquid interface, swelling the uppermost few nanometers of the polymer surface, giving the impression of a softer material upon its second measurement.
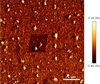 |
Fig. 6 Young's modulus map showing a zoomed-in region previously scanned under liquid ethanol. |
5 Conclusion
We conclude that ethanol is suitable for cleaning PMMA at low temperatures and for short periods of solid/liquid contact. Although ethanol does not dissolve PMMA, prolonged exposure has the potential to cause surface-level softening, leaching, and can introduce micro-crazing − effects that may compromise both the aesthetic and ethical dimensions (long-term integrity; reversibility of changes) of conservation treatment. The disconnect between solubility parameters and experimentally-observed micro/nano structural changes reinforces the need for empirical testing. Many conservation treatments involve contact in addition to, or instead of immersion; further studies using gels, vapor, or swab applications are therefore warranted. Exploring alternative solvents with more similar Hildebrand solubility parameters, or non-polar solvents which could be considered less aggressive towards PMMA, may offer safer solutions for conservation. However, the wide variety of conceivable surface contaminants means that acquiring a broad understanding of solvent suitability decreases the risk of irreversible damage occurring to historic and culturally meaningful PMMA artefacts.
Glossary
AFM: Atomic force microscopy
FTIR-ATR: Fourier transform infrared spectroscopy − attenuated total reflectance
PMMA: Polymethyl methacrylate
RH: Relative humidity
Acknowledgments
PM, SRC, and JB gratefully acknowledge the support kindly offered by the following people: Joerg Barner, Alexander Dulebo, Thomas Henze, and Andre Koernig, Bruker Nano Surfaces and Metrology Division, Germany; Rhys Jones, Alison Kelly, and Stephen Lewandowski, Bruker UK; Emma Dewberry, The Open University, UK; Louise Dennis, Museum of Design in Plastics, UK.
Funding
PM, SRC, and JB thank the Open-Oxford-Cambridge AHRC DTP Collaborative Doctoral Award for funding.
Conflicts of interest
The authors have no conflicts of interest to disclose.
Data availability statement
The datasets used and/or analyzed during the current study are available from the corresponding author on reasonable request.
Author contribution statement
Conceptualization, JB and SRC; Methodology, JB, SRC, PM; Writing − Original Draft Preparation, SRC, PM, and JB; Writing − Review & Editing, JB; Supervision, SRC and JB; Project Administration, JB; Funding Acquisition, SRC and JB.
References
- L.V. Angelova, G. Sofer, A. Bartoletti, B. Ormsby, A comparative surface cleaning study of Op Structure, an Op Art PMMA sculpture by Michael Dillon, J. Am. Inst. Conserv. 62, 58 (2023). https://doi.org/10.1080/01971360.2022.2031459 [Google Scholar]
- S. Kavda, E. Richardson, S. Golfomitsou, The use of solvent-gel systems for the cleaning of PMMA, MRS Adv. 2, 2179 (2017). https://doi.org/10.1557/adv.2017.249 [Google Scholar]
- M. Lazzari, D. Reggio, What fate for plastics in artworks? An overview of their identification and degradative behavior, Polymers 13, 883 (2021). https://doi.org/10.3390/polym13060883 [Google Scholar]
- Y. Yan, Y. Sun, J. Su, B. Li, P. Zhou, Crazing initiation and growth in polymethyl methacrylate under effects of alcohol and stress, Polymers 15, 1375 (2023). https://doi.org/10.3390/polym 15061375 [Google Scholar]
- L. Dennis, A brief history of the use of plastics, Camb. prism., Plast. 2, 19 (2024). https://doi.org/10.1017/plc.2024.17 [Google Scholar]
- B. Ormsby, A. Bartoletti, K.J. van den Berg, C. Stavroudis, Cleaning and conservation: recent successes and challenges, Herit. Sci. 12, 10 (2024). https://doi.org/10.1186/s40494-023-01113-0 [Google Scholar]
- Y. Shashoua, M. Alterini, G. Pastorelli, L. Cone, From microfiber cloths to poly(vinyl alcohol) hydrogels − conservation cleaning of plastics heritage, J. Cult. Herit. 52, 38 (2021). https://doi.org/10.1016/j.culher.2021.08.009 [Google Scholar]
- N. Balcar, G. Barabant, C. Bollard, S. Kuperholic, B. Keenan, A. Laganà, T. Van Oosten, K. Segel, Y. Shashoua, Studies in cleaning plastics, in POPART. Preservation of Plastic ARTefacts in Museum Collections, edited by B. Lavédrine, A. Fournier, G. Martin (CTHS éditions, Paris, 2012), p. 221 [Google Scholar]
- E. Balliana, G. Ricci, C. Pesce, E. Zendri, Assessing the value of green conservation for cultural heritage: positive and critical aspects of already available methodologies, Int. J. Conserv. Sci. 7, 185 (2016) [Google Scholar]
- J. Nixdorf, G. Di Florio, L. Bröckers, C. Borbeck, H.E. Hermes, S.U. Egelhaaf, P. Gilch, Uptake of methanol by poly(methyl methacrylate): an old problem addressed by a novel Raman technique, Macromolecules 52, 4997 (2019). https://doi.org/10.1021/acs.macromol.9b00205 [Google Scholar]
- S. Kavda, S. Golfomitsou, E. Richardson, Effects of selected solvents on PMMA after prolonged exposure: unilateral NMR and ATR-FTIR investigations, Herit. Sci. 11, 63 (2023). https://doi.org/10.1186/s40494-023-00881-z [Google Scholar]
- F. Rahman, D.J. Carbaugh, J.T. Wright, P. Rajan, S.G. Pandya, A review of polymethyl methacrylate (PMMA) as a versatile lithographic resist − with emphasis on UV exposure, Microelectron. Eng. 224, 111238 (2020). https://doi.org/10.1016/j.mee.2020. 111238 [Google Scholar]
- Y. Yan, Y. He, Y. Geng, Z. Hu, X. Zhao, Characterization study on machining PMMA thin-film using AFM tip-based dynamic plowing lithography, Scanning 38, 612 (2016). https://doi.org/10.1002/sca.21308 [Google Scholar]
- P.Y. Lin, Y.T. Lin, F. Yang, S. Lee, Effects of gamma ray and sub-cracks on ethanol-assisted crack healing in poly(methyl methacrylate), Mater. Chem. Phys. 162, 244 (2015). https://doi.org/10.1016/j.matchemphys.2015.05.064 [Google Scholar]
- R.N. Leach, F. Stevens, C. Seiler, S.C. Langford, J.T. Dickinson, Nanometer-scale solvent-assisted modification of polymer surfaces using the atomic force microscope, Langmuir 19, 10225 (2003). https://doi.org/10.1021/la035289n [Google Scholar]
- F. Stevens, R.N. Leach, S.C. Langford, J.T. Dickinson, Influence of molecular weight on nanoscale modification of poly (methyl methacrylate) due to simultaneous mechanical and chemical stimulation, Langmuir 22, 3320 (2006). https://doi.org/10.1021/la0523006 [Google Scholar]
- P.J. Bouma, W. De Groot, A.A. Kruithof, J.L. Ouweltjes, in Physical Aspects of Color: an Introduction to the Scientific Study of Color Stimuli and Color Sensations (Macmillan, London, 1971) [Google Scholar]
- J. Schwiegerling, in Field Guide to Visual and Ophthalmic Devices (SPIE Press, Bellingham, Washington, 2004) [Google Scholar]
- International Organization for Standardization, Plastics — Methods of exposure to laboratory light sources. Part 2: Xenon-arc lamps (ISO Standard No. 4982-2:2013), (2013). https://www.iso.org/standard/55481.html [Google Scholar]
- S. Babo, J.L. Ferreira, A.M. Ramos, A. Micheluz, M. Pamplona, M.H. Casimiro, L.M. Ferreira, M.J. Melo, Characterization and long-term stability of historical PMMA: impact of additives and acrylic sheet industrial production processes, Polymers 12, 2198 (2020). https://doi.org/10.3390/polym12102198 [Google Scholar]
- T. Bubmann, S. Shi, A. Brueckner, T. Menzel, H. Ruckdäschel, A.K. Schlarb, V. Altstädt, Influence of sample wetting method on ESC-behavior of PMMA under dynamic fatigue crack propagation, Materials 15, 4114 (2022). https://doi.org/10.3390/ma 15124114 [Google Scholar]
- M. Vayer, A. Vital, C. Sinturel, New insights into polymer-solvent affinity in thin films, Eur. Polym. J. 93, 132 (2017). https://doi.org/10.1016/j.eurpolymj. 2017.05.035 [Google Scholar]
Cite this article as: Panagiotis Morfis, Simon R. Collinson, James Bowen, Solvent-induced softening of polymethyl methacrylate surfaces studied using atomic force microscopy, Eur. Phys. J. Appl. Phys. 100, 28 (2025), https://doi.org/10.1051/epjap/2025026
All Tables
All Figures
|
Fig. 1 Optical microscope images of the PMMA surface after immersion in liquid ethanol at 20 °C: (a) 0 min; (b) 5 min; (c) 30 min; (d) 45 min. |
| In the text | |
|
Fig. 2 Raman spectra of PMMA before and after 48 h immersion in liquid ethanol at 20 °C. |
| In the text | |
|
Fig. 3 FTIR-ATR spectra of PMMA before and after 48 h immersion in liquid ethanol at 20 °C. |
| In the text | |
|
Fig. 4 Topography of (a) the unexposed PMMA surface; (b) the PMMA surface after 120 mins immersion in liquid ethanol at 20 °C. |
| In the text | |
|
Fig. 5 Surface softening of PMMA during immersion in liquid ethanol at 20 °C. (a) Histograms of Young's modulus showing: (i) 5 mins; (ii) 60 mins; (iii) 120 mins; (b) Evolution of Young's modulus during 120 mins immersion. |
| In the text | |
|
Fig. 6 Young's modulus map showing a zoomed-in region previously scanned under liquid ethanol. |
| In the text | |
Current usage metrics show cumulative count of Article Views (full-text article views including HTML views, PDF and ePub downloads, according to the available data) and Abstracts Views on Vision4Press platform.
Data correspond to usage on the plateform after 2015. The current usage metrics is available 48-96 hours after online publication and is updated daily on week days.
Initial download of the metrics may take a while.