| Issue |
Eur. Phys. J. Appl. Phys.
Volume 99, 2024
|
|
|---|---|---|
| Article Number | 13 | |
| Number of page(s) | 13 | |
| DOI | https://doi.org/10.1051/epjap/2024230213 | |
| Published online | 25 April 2024 | |
https://doi.org/10.1051/epjap/2024230213
Original Article
Comparison of helium and argon for the production of carbon monoxide (CO) by a plasma jet for biomedical applications
GREMI UMR7344 CNRS, Université d'Orléans, Orléans, France
* e-mail: This email address is being protected from spambots. You need JavaScript enabled to view it.
Received:
8
November
2023
Accepted:
29
January
2024
Published online: 25 April 2024
Abstract
Carbon monoxide (CO) has anti-inflammatory properties and its production by plasma could be a significant advantage in the field of plasma medicine. We characterized a pulsed kHz-driven plasma jet to produce CO for biomedical applications. With no target interaction, the CO2 conversion into CO, the breakdown voltage and energy delivered to the plasma were investigated for two noble carrier gases: helium and argon. The breakdown voltage and the energy delivered to the plasma in argon gas were twice as high as in helium. The breakdown voltage was barely affected by the gas flow rate and the applied voltage, while it decreased slightly with the excitation frequency because the amount of residual charges increases with the frequency. However, the energy delivered to the plasma was not particularly affected by a change in frequency or gas flow rate, while it increased linearly with the applied voltage. CO production rose from a couple of ppm to about 2000 ppm for a specific energy input from 2 to 2000 J/L (5 × 10⁻⁴ to 5200 × 10−4 eV/(atom or molecule)), making this plasma source safe in terms of CO production for biomedical applications. Unlike literature results, the nature of the noble carrier gas did not have an impact on CO production. The CO concentration produced with 0.3% CO2 admixture increased linearly with the specific energy input (SEI) until reaching a plateau at about 2100ppm. This implies that loss processes were negligible and that CO2 dissociation was mainly due to energetic particles such as electrons and excited noble atoms. The conversion decreased with the ratio of CO2. Helium and argon as carrier gases are equivalent in terms of CO production and the CO concentration can be controlled by the SEI and the ratio of CO2.
Key words: CO2 conversion / plasma jet / plasma medecine / CO medecine
© E. Mestre et al., Published by EDP Sciences, 2024
 This article is distributed under the terms of the Creative Commons Attribution License https://creativecommons.org/licenses/by/4.0 which permits unrestricted use, distribution, and reproduction in any medium, provided the original author(s) and source are credited.
1 Introduction
Over the last two decades, interest in non-equilibrium atmospheric pressure plasma jets has risen significantly [1]. They have the attractive feature of producing a low temperature plasma able to propagate away from the electrode confinement into the ambient air, forming a so-called plume. This plume gives the ability to locally interact with biological targets with a low risk of burning. Plasma jets have the advantage of producing a wide range of reactive species combined with an electric field and radiation, while keeping the gas temperature near the room temperature. They can therefore be used in various applications such as food preservation, agriculture and medicine [2–4]. In contact with living tissues, plasma shows various beneficial effects, including antibacterial, vasodilatory, anti-apoptotic, anti-cancerous, and anti-proliferative effects [5–12].
Although plasma has achieved great results in numerous medical applications, its role on inflammation remains unclear. Several studies on animals and humans show that plasma can sometimes have no effect in the inflammation stage, and sometimes have a pro-inflammatory or an anti-inflammatory effect [13]. In the literature, nitric oxide (NO) is often cited as a molecule that could be responsible for inflammation regulation in plasma treatment, due to its important role in wound healing [14]. It is in fact responsible for both upregulation and downregulation of the inflammatory phase, and acts as pro-inflammatory or as anti-inflammatory depending on its concentration [15]. As NO is highly reactive, controlling the amount of this molecule on the target is a big challenge, especially in the context of inflammation regulation.
Carbon monoxide (CO) has a bad reputation due to the lethal consequences when inhaled at high concentrations. However, at low concentration, it has a broad spectrum of biological activities such as anti-inflammatory, vasodilatory, anti-apoptotic, and anti-proliferative effects. Additionally, CO is naturally produced in mammalian cells as a signaling molecule [16–21]. Compared to NO, CO is a stable molecule in the gas phase and in vivo [22–24]. Additionally, CO does not exert pro-inflammatory activities and has only anti-inflammatory properties [22–24]. A further advantage is that it can be better controlled, since it does not produce byproducts [18]. Compared to NO, in stress conditions, the bioavailability of CO is not compromised and can still exert it signaling properties [22]. Therefore, CO represents an excellent alternative to better control inflammation.
CO can be easily produced by plasma from the dissociation of carbon dioxide (CO2) [25]. The local controlled CO production by plasma has the advantage of avoiding storing CO gas in the cylinder, which is often prohibited in clinical environments. For medical purposes, pure CO2 dielectric barrier discharges (DBDs) are generally too hot to be used directly [26]. We therefore used a plasma jet with noble gas as carrier gas, which is an appropriate discharge for biomedical applications since its temperature is close to room temperature.
Douat et al. reported that a helium plasma jet with 1% CO2 admixture produced CO in a range from tens to a couple of thousands of ppm, meaning that the source was safe for clinical applications in terms of CO concentration [27]. However, in their configuration, the powered electrode was in direct contact with the plasma, and Judée et al. demonstrated that an arc can be initiated between the powered electrode and the target [6]. To prevent arc formation, we chose in this paper a configuration where the two electrodes were wrapped around a dielectric tube, enabling us to compare helium and argon as carrier gas for the production of CO.
In this paper, we present a comparative study on the production of CO in a helium/CO2 and an argon/CO2 DBD-like plasma jet with no target. The breakdown voltage and the energy delivered to the plasma were measured and the concentration of CO produced by plasma was evaluated by IR absorption spectroscopy with a gas analyzer. The aim of the study was to compare argon and helium in terms of electrical characteristics and CO2 conversion, in order to find the most suitable configuration for medical use.
2 Experimental setup
2.1 Plasma discharge
The external rings DBD jet represented in Figure 1 was composed of a borosilicate glass tube with an external diameter of 4 mm and an internal diameter of 2 mm. Two 5 mm wide copper tapes spaced 14 mm apart were wrapped around the tube. The upper tape was connected to a homemade high-voltage power supply, which delivered a positive microsecond-duration voltage pulse with a kHz repetition rate. Figure 2 represents an example of the voltage waveform. The overall shape was independent of the magnitude of the applied voltage and of the pulse frequency. From 2 kV up to 15 kV, the voltage rise time (defined here between 10% and 90% of the maximum values) and the full‐width at half‐maximum were constant, and rose in (0.92 ± 0.03) μs and (1.55 ± 0.01) µs respectively. The lower tape, in Figure 1 was wrapped 14 mm away from the reactor nozzle and connected to a grounded resistor (R = 1 kΩ). To prevent arc formation in air, three glass beads were added between the two electrodes and each electrode was covered by epoxy resin.
Helium (99.999% purity) or argon (99.999% purity) gas mixed with 0 to 1.2% CO2 (99.999% purity) was flowed through the glass tube in a 100–2000 standard cubic centimeter per minute (sccm) range, regulated by calibrated mass flow controllers (EL-FLOW Prestige Bronkhorst).
 |
Fig. 1 Schematic (left) and picture (right) of the experimental setup. |
 |
Fig. 2 High-voltage waveform of one pulse. |
2.2 Electrical diagnostics
The applied voltage, Vapp, and the current were respectively measured between the anode and the ground with a high-voltage Tektronix P6015A probe (75 MHz and 1000:1 division ratio), and across a grounded resistor with a voltage LeCroy PP006A probe (500 MHz and 10:1 division ratio). The signals were recorded using a 500 MHz bandwidth digital oscilloscope (Tektronix MDO 3054).
With no plasma (plasma off), the reactor was similar to a capacitor and the measured current through the resistor was a capacitive current, Icapa. To measure it, pure CO2 gas was flowed through the discharge. As the breakdown voltage is much higher in molecular gases than in noble gases, no plasma was ignited in this condition. From this current waveform, the capacitance of the reactor, C, was calculated as:
 (1)
(1)
We found C = 0.27±0.01 pF, a value that is in the same order of magnitude as the capacitance measured for similar plasma jet reactors [28,29]. Sobota et al. showed that the capacitance of their system was mostly due to the gas and not to the dielectric tube. In our case, the capacitance of the reactor was also measured in argon and helium and the same values as with CO2 were found.
When the plasma is ignited (plasma on), the current measured through the resistor is composed of the capacitive current, Icapa, and the discharge current, Id. To measure it, it requires subtracting the capacitive current, Icapa, from the total current Itot:
 (2)
(2)
The electrical characterization of the plasma jet was established with two physical quantities:
the breakdown voltage (Vbd): it marks the transition between a non-self-sustaining and a self-sustaining discharge, in other words, when the plasma is turned on [30]. To estimate it, we measured the value of the applied voltage when the discharge current reached 10% of its maximum value, as shown in Figure 3 [31,32].
the energy consumed by the plasma during one pulse (E):
E was calculated by integrating the instantaneous power (voltage-current product) over one pulse [33,34]:
 (3)
(3)
A temporal representation of the instantaneous power in helium (10 kV, 20 kHz, 1000 sccm) is given in Figure 4. In this example, the energy delivered to the plasma was equal to (27±3) μJ.
The energy consumed by the plasma can also be measured thanks the Lissajous method. The resistor was replaced by a capacitor and from the voltage measured across it, the charge was deduced. The charge was then plotted as a function of the applied voltage. The energy dissipated in the gas discharge per pulse was equal to the enclosed area of this Lissajous figure [35,36].
A temporal representation of the Lissajous figure in helium (10 kV, 20 kHz, 1000 sccm) is given in Figure 5. A 2.2 nF capacitor was used. In this case, the energy consumed was (24±3) μJ.
The comparison between the two methods was done for several plasma parameters and the value of the energy was always the same considering the error. Therefore, the two methods can be considered equivalent. For the rest of the paper, we used the integration method (Eq. (3)).
 |
Fig. 3 Applied voltage waveform (Black-left) and discharge current waveform (Red-right). The breakdown voltage, Vbd, was estimated at 10% of the maximum value of the discharge current. |
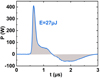 |
Fig. 4 Instantaneous power and its corresponding temporal integration equal to the energy delivered to the plasma (E). Vapp = 10 kV, freq = 20 kHz, helium flow rate = 1000 sccm. |
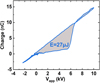 |
Fig. 5 Lissajous figure. Vapp = 10 kV, freq = 20 kHz, helium flow rate = 1000 sccm. |
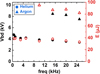 |
Fig. 6 Breakdown voltage (Vbd) and energy delivered to the plasma (E) in Helium/CO2 ({99.7/0.3} %) or Argon/CO2 ({99.7/0.3} %) plasma versus the frequency. The data were recorded at 10 kV with a total gas flow rate of 1000 sccm. |
2.3 Measurement of CO formation
A gas analyzer was used to measure the concentration of CO and O2 molecules (SIEMENS Ultramat23). The experimental setup is shown in Figure 1. A funnel was placed underneath the reactor and the distance between the funnel's bottleneck and the nozzle of the reactor was 30 mm. The analyzer pumped gas samples from the funnel with a gas flow rate between 1000–1500 sccm. The sampled volume, Vsampled, was composed of a gas volume from the exhaust of the plasma, Vplasma, and a gas volume from the surrounding air, Vair:
 (4)
(4)
where x = Vplasma/Vsampled and y = Vair/Vsampled, inducing x + y = 1.
The concentration of CO molecules measured by the gas analyzer, [CO]measured, is expressed as:
 (5)
(5)
while the concentration of CO molecules in the plasma, [CO]plasma, is expressed as:
 (6)
(6)
By combining equations (5) and (6), we get:
 (7)
(7)
x was estimated from y, deduced from the measurement of the O2 molecules concentration, [O2]measured. The dissociation of CO2 can lead to the formation of O2 molecules ( ). As the maximum value of CO concentration in this work was 2000 ppm, the production of O2 in the plasma could not exceed 1000 ppm, which represents 0.1 %. This value, in a first approximation, is negligible compared to the concentration of O2 in air, which is 21 %. Hence, we assumed that the concentration of O2 measured by the gas analyzer, [O2]measured, gave only an indication of the ratio of Vair over Vsampled :
 (8)
(8)
Finally, by combining equations (7) and (8), [CO]plasma is expressed as:
 (9)
(9)
The measuring range of the gas analyzer was 0–500 ppm with an accuracy of 2 ppm for CO and 0–25% with an accuracy of 0.25% for O2. The error of [CO]plasma was established from an uncertainty propagation calculation, knowing the accuracy of [CO]measured and [O2]measured.
The backward reaction of CO with O2 to form CO2 is negligible when the temperature does not exceed 3000K [23], which was the case in this study. Moreover, CO is not easily oxidized or reduced [37], which makes this molecule very stable in time in the gas phase. To make sure that CO molecules were not lost in the gas phase, the concentration was measured versus the time of flight of the gas from the plasma to the gas analyzer. We observed that the number of CO molecules was not influenced, meaning that the processes involving long-lifetime molecules were negligible here. Thus, we can conclude that in our conditions, CO was a stable molecule and we assumed that [CO]plasma represented the concentration of CO produced in the plasma.
3 Results and discussion
3.1 Electrical study
The study of the influence of the electrical parameters on the discharge was performed for a fixed concentration of 0.3% CO2 for two different carrier gases: argon and helium. The breakdown voltage and the energy delivered to the plasma were recorded by varying one electrical parameter at a time. The standard value of the applied voltage (measured at its maximum) was 10 kV, the frequency 20 kHz and the total gas flow rate 1000 sccm. This means that if Vbd and E were measured for different voltages, the frequency and the gas flow rate were at their standard value (20 kHz, 1000 sccm).
3.1.1 Effect of frequency
Figure 6 shows the influence of the frequency on the breakdown voltage (left axis and full black symbols) and on the energy delivered to the plasma (right axis and red open symbols) for argon (triangle) and helium (dot) discharges mixed with 0.3% CO2.
In both gas mixtures, increasing the frequency from 1 to 25 kHz did not significantly change the energy delivered to the plasma, E, which remained close to 30 μJ in helium and 90 μJ in argon.
The breakdown occurred at a voltage close to 4 kV in helium while it was between 8 and 10 kV in argon. It can be seen that the breakdown voltage decreased slightly with the frequency, and that it was more pronounced for argon. In our case, only one current peak was observed per voltage pulse. As the time between two successive pulses (from 33 μs to 1000 μs in 1–30 kHz range) was lower than the recombination time (the characteristic time for ion-electron recombination does not exceed 1 μs in a helium plasma jet [38]), most charged species recombine before the next pulse. This means that at each pulse a new plasma was ignited. The breakdown voltage depends on the amount of residual charges. The higher this amount, the lower the electric field required for breakdown. The amount of residual charges increases with the frequency and explains why in Figure 6 the breakdown voltage decreased slightly with the frequency.
3.1.2 Effect of total gas flow
Figure 7 shows the influence of the total gas flow rate in helium and in argon with 0.3% of CO2 admixture on the breakdown voltage (left axis and full black symbols) and on the energy delivered to the plasma (right axis and red open symbols). For both gas mixtures, the breakdown voltage increases slightly to a plateau of (3.8 ± 0.2)kV for helium and (8.9 ± 0.2)kV for argon. The energy delivered to the plasma follows the trend of the breakdown voltage except for a low gas flow rate in helium.
Nierman et al. measured the concentration of argon and helium metastable atoms in a radiofrequency (RF) excitation plasma jet. They showed that the concentration of metastable atoms increased with the gas flow rate, which was probably due to a decrease in the impurity rate from air leaking into the carrier gas [39]. In helium, a small quantity of impurities helps the plasma ignition due to Penning ionization [40], and could explain in our case why the breakdown voltage increased with the gas flow rate. However, we observed a similar trend for argon, and Penning ionization cannot be the explanation for this gas, since such ionization is impossible in argon.
Another possibility to explain the dependency of the breakdown voltage in argon and helium as a function of the total gas flow rate is to consider the residual charges between two pulses. Ions and/or electrons are located on the surface of the dielectric and/or in the gas volume in the dielectric tube. The gas flow cannot affect the amount of surface charges due to the electrostatic force that causes them to stick to the surface. However, the flow can influence the amount of residual charges in the gas volume. Thus, it could decrease the amount of charges with the flow, and would increase the breakdown voltage.
 |
Fig. 7 Breakdown voltage (Vbd) and energy delivered to the plasma (E) in Helium/CO2 ({99.7/0.3} %) or Argon/CO2 ({99.7/0.3} %) plasma versus the total gas flow rate. The data were recorded at 10 kV and 20 kHz. |
3.1.3 Effect of applied voltage
Figure 8 presents the energy delivered to the plasma (full black symbols) and the breakdown voltage (open red symbols) as a function of the applied voltage in helium (dot symbols) and in argon (triangle symbols) with 0.3% CO2 in the admixture. For both gas mixtures, the breakdown voltage was more and less constant with the applied voltage and rose about 4 kV in helium and 8 kV in argon. The applied voltage can change the breakdown voltage if the voltage at breakdown exceeds the static breakdown voltage, which happens in pulsed operation for sufficiently fast applied voltage rise times [41]. Generally, it occurs for an increase of a couple of tens kV over a couple of nanoseconds [42]. As we used a microsecond high voltage with a maximum of 14 kV, the rise of the voltage was slow enough to avoid this effect and explains why the breakdown voltage was barely affected by the applied voltage (full black symbols in Fig. 8).
Figure 8 shows that the energy delivered to the plasma increased linearly with the applied voltage. This result was expected. The power supply delivers energy to the plasma when the plasma is present, meaning during the time when the current discharge is not equal to zero. In Figure 3, this time rose by about 2 μs, and during this time, the applied voltage increased from 4 kV to the maximum applied voltage, which was 10 kV in the example. As the energy delivered to the plasma was calculated by the integration over time of the current discharge multiplied by the applied voltage (cf. Eq. (3)), if the applied voltage increases, the energy increases as well. This explains why the energy delivered to the plasma increased with the applied voltage, while the breakdown voltage remained more and less constant.
Figures 6,7 and 8 show that the breakdown voltage in argon was about twice that in helium. This is due to a difference in the breakdown electric field in helium and argon. Figure 9 shows comparisons of the direct ionization coefficients, in pure helium and pure argon. Ionization coefficients were calculated via the freeware solver BOLSIG+ (version 2019) as a function of the reduced electric field (E/N) [43], with the Phelps collision cross‐section database for the resolution of the Boltzmann equation [44]. As the gas temperature was estimated in a range of 320–330 K with a fiber optic GaAs temperature sensor (Optocon), the calculations were done for 330 K.
The ionization coefficient is larger in argon at high reduced electric fields (over 100 Td), but in helium it becomes much larger for fields below 100 Td. Darny et al. measured the electric field experimentally in a helium plasma jet and found that it was in the range of a couple of kV/cm [45]. As the temperature of the gas was close to room temperature, it means that the reduced electric field increased by a couple of tens Td. Breden et al. calculated from a numerical model that in a plasma jet the reduced field was below 100 Td [46]. Therefore, we can assume that the reduced electric field in a plasma jet must be between 10 and 100 Td. In this range, as shown in Figure 9, the ionization coefficient is higher in helium than in argon, which explains why the breakdown voltage was lower in helium than in argon.
The energy delivered to the plasma in argon was twice that in helium. The energy delivered to the plasma is directly related to the breakdown voltage: for a higher breakdown voltage, the discharge current occurs later in the voltage pulse, leading to a higher instantaneous power (cf Eq. (3)) and finally a higher energy delivered to the plasma. Moreover, the root mean square (RMS) current was higher in argon than in helium for the same settings. This is an additional effect leading to a higher energy delivered to plasma in this gas. The discharge current in argon is generally more intense than in helium due to the smaller ionization energy of argon atoms, as depicted in Figure 10 [47].
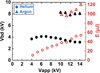 |
Fig. 8 Breakdown voltage (Vbd) and energy delivered to the plasma (E) in Helium/CO2 ({99.7/0.3} %) or Argon/CO2 ({99.7/0.3} %) plasma versus the applied voltage. The data were recorded at 20 kHz with a total gas flow rate of 1000 sccm. |
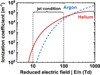 |
Fig. 9 Ionization coefficient as a function of the reduced electric field in pure helium and pure argon discharge. From Boltzig+. |
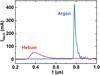 |
Fig. 10 Temporal representation of the discharge current in Helium/CO2 ({99.7/0.3} %) or Argon/CO2 ({99.7/0.3} %). The data were recorded at 20 kHz with a total gas flow rate of 1000 sccm and a frequency of 20 kHz. |
3.2 Production of CO
3.2.1 Influence of the specific energy
The specific energy input (SEI) is a parameter commonly used to quantify CO2 dissociation by plasma [27,48]. It is an intensive parameter depicting the average energy given to each atom or molecule of the gas for one cycle (or pulse in our case). It is defined as:
 (10)
(10)
where Pavg is the average power input in the plasma, E, the average energy delivered to the plasma during one pulse (cf. Eq. (3)), f, the frequency of the pulsed applied voltage and φ the total gas flow rate in standard conditions (T0 = 273.15 K, p0 = 1.013 bar). One can see that the SEI increases with the frequency and the energy delivered to the plasma, while it decreases with the gas flow. Thus, the SEI can be tuned by varying the frequency, the gas flow rate and the applied voltage since it is proportional to the energy delivered to the plasma (cf. Fig. 8).
The influence of the SEI on CO production by plasma in argon (full blueish symbols) or in helium (open reddish symbols) with 0.3% of CO2 in the gas mixture is shown in log-log scale in Figure 11. The shape of the symbols is related to the SEI tuned parameter (square symbols for a variation of the applied voltage, circles for the flow and triangles for the frequency). The concentration of CO was plotted in parts-per-million (ppm) (left axis) and the conversion degree in percentage (right axis), which is defined as the ratio of the final concentration of CO over the initial concentration of CO2:
 (11)
(11)
Figure 11 shows that the production of CO by plasma rose from a couple of ppm to about 1000 ppm. The typical concentrations used in CO inhalation clinical trials are from 100 ppm to 4000 ppm. 4000 ppm was only tested once, and most of the trials were performed with a concentration from 100 to 500 ppm [49]. Note that the CO concentration measured in our case was comparable with the one used in CO inhalation clinical trials. This means that this plasma source is safe in terms of CO production [18].
We observed that the concentration of CO increased linearly with the SEI up to 200 J/l (520 eV/atom or molecule). As the scale was logarithmic, this means that the conversion degree followed a power law as a function of the SEI below 200 J/l (α ∝ SEIm), where m is the slope of the line in log-log scale). We found m = 0.93 ± 0.11. In a previous study, Douat et al. showed in a helium plasma jet with 1% of CO2 that the production of CO increased with the SEI [27], but the trend was not a perfect straight line as in Figure 11, probably due to the presence of parasite corona discharges in the reactor. Their presence must have increased the energy consumption and therefore the SEI as well. In the present work, we made sure that the geometry of the plasma reactor prevented any ignition corona discharge, confirmed by the current waveform since no parasite current peaks were observed (cf. Fig. 10). Thus, the energy consumption measured was related only to plasma jet ignition.
In the literature, three main reaction channels that can lead to the dissociation of CO2 into CO are described [50]:
dissociation via vibrational pumping of CO2 along the asymmetric mode,
excitation transfer from a direct impact of energetic particles (electrons or excited noble gas species) with CO2 followed by direct dissociation,
excitation transfer from a direct impact of energetic particles (electrons or excited noble gas species) with CO2 followed by dissociative recombination.
Previous studies showed that in kHz pulsed DBD, dissociation via vibrational pumping of CO2 does not play a significant role and can thus be neglected in this work [37,51]. The energy threshold for direct impact dissociation of CO2 with energetic particles is around 7 eV [23]. Energetic electrons but also excited atoms might play an important role in CO2 dissociation. The lowest energy levels of argon and helium metastable atoms are respectively 11.6 eV and 19.8 eV, and are significantly higher than 7 eV. Therefore, metastable atoms act as an energy reservoir in plasma jets [52,53].
As explained in the experimental setup section, in the gas phase, CO was very stable and its concentration was not influenced by the time of flight of the gas from the plasma to the gas analyzer. Thus, the measured concentration of CO was equal to the one produced in the plasma. In plasma phase, the loss of CO due to electron impact dissociation was negligible because this reaction requires about twice as much energy as the electron impact dissociation of CO2 [37]. CO could also be lost by two backward reactions involving the atomic oxygen O (three-body reaction) or the negative ion O− (electron detachment) [54]. These two reactions play a significant role if O and O− remain in the gas more than a couple of ms [55]. Generally, negative ions have a longer lifetime than positive ions, since positive ions can recombine [56]. However, O− and O are very reactive and quickly form other species, which means that to keep a significant number of these two species, they have to be constantly produced by the plasma. In this work, the voltage was pulsed, and the duration of the plasma did not excess 2 µs. As a result, as the lifetime of O and O− is very short, and as the residence time in plasma was lower than hundreds of ms, the backward reactions involving these two species were negligible [54]. Thus, we can conclude that in our case there was no CO backward reaction.
As the dissociation of CO2 was probably due to an excitation transfer from a direct impact of energetic particles, it can be modeled by a very simple schema such as the reaction [50]

where X* is an energetic particle and may correspond to an excited helium or argon atom or an energetic electron. The reaction can be described by an overall rate constant k. The density change of CO2 has to obey
 (12)
(12)
as  , we can write
 (13)
(13)
The concentration of X* over time must follow a very fast increase synchronized with the discharge current up to a maximum, followed by an exponential decay as shown in Figure 12a. As there is no analytical solution with an exponential decay function, we simplified [X*] by a rectangular function, where [X*]=X*max during the lifetime (∆t) of X and [X*]=0, the rest of the time (Fig. 12b).
As a result, we found:
 (14)
(14)
To link this equation to the results presented in Figure 11, we need to make SEI appear from  .
.
During plasma ignition, all the energy goes to electrons before being used for something else (chemistry, heating, etc.) [57]. Golda et al. showed in a helium RF plasma jet that the density of electrons increases linearly with the dissipated power [58], and Qian et al. and Wu et al. measured that in a pulsed kHz-driven plasma jet in argon and helium the electron density increased linearly with the voltage [59]. As the dissipated energy was proportional to the applied voltage (cf. Fig. 8), we can assume that the electron density was proportional to SEI (ne ∝ SEI). X* represents the energetic particles (electrons and excited noble gas atoms). As excited noble gas atoms depend on the number of electrons, we can assume that their concentration was proportional to the electron density. Finally, we can write that  , where A is a constant, and we found that
 (15)
(15)
The same results of Figure 11 have been plotted in linear scale in Figure 13 with no distinction of plasma parameters such as carrier gas, voltage, flow rate and frequency. Additionally, data points corresponding to SEI higher than 200 J/l have been added to the graph, which highlights a saturation at around 70% of CO2 conversion. The concentration of CO followed a linear trend up to 200 J/l (m = 0.93 ± 0.11, which is very close or equal to 1), which means that equation (13) can be written as  , implying that
  is valid when SEI < 200 J/l. As
  , it means that α ∝ SEI m with m = 1.
By comparison, in pure CO2 DBD, the slope is m = 0.75 [26,60]. With a macroscopic model, Brehmer et al. explained that if loss processes are absent, the slope rises to m = 1 [26]. They assumed that the concentration of CO2 was constant since they measured a conversion degree lower than 5%, corresponding to the approximation  . By taking into account the loss process via the three-body recombination with atomic oxygen, CO and the wall or any species in the gas, Brehmer et al. found in their macroscopic model that the slope rises m = 0.5 [26]. This provides further support that in our case, loss processes are negligible and that CO2 dissociation was mainly due to energetic particles (electrons and excited noble atoms).
Figure 13 shows that for SEI higher than 200 J/l (520 eV/atom or molecule), the conversion degree reached a plateau at around 70% (cf. Fig. 11). Thus, the approximation  was no longer valid. In the long term, equation (13) tends to 100%. However, in our case, the horizontal asymptote was at around 70% and not 100% as Stewig et al. observed experimentally [50]. Stewig et al. used an RF plasma, while in this paper we used a kHz plasma jet. This difference could be explained by the nature of the reactor.
It can be seen in Figure 11 that data for Ar/CO2 and He/CO2 overlap, suggesting that the nature of the carrier gas did not have an impact on the CO2 dissociation, whereas argon and helium plasmas exhibit different features. As observed in Figures 6–8, the breakdown voltage was twice as high in argon as in helium, inducing a higher energy delivered to the plasma and thus a higher SEI. With the parameters chosen for this study, the SEI of the Ar/CO2 plasma never fell below 50 J/l, while it could go down to 10 J/l for He/CO2 plasma. Due to the differences between helium and argon plasma jets, we could have expected to observe a different trend of CO concentration versus the SEI. Additionally, these results are contradictory to results reported in the literature.
Stewig et al. observed in an RF plasma a different behavior in Ar/CO2 and He/CO2 plasma [50]. They found that the CO2 conversion was four times more efficient when argon was used as carrier gas. Dedrick et al. also observed a significant increase in conversion efficiency in argon compared to helium in an RF plasma jet [50,61]. Ramakers et al. studied both experimentally and by modeling CO2 conversion in DBD fed with argon or helium as a function of the addition of CO2 in the gas mixture from 0 to 100 % [62]. With a CO2 concentration below 30%, the conversion was higher in argon than in helium, while it was similar in the two carrier gases from 30% to 100%.
Ramakers et al. attributed the better efficiency of CO2 conversion in argon compared to helium to a higher electron density in argon compared to helium due to the lower ionization energy. Stewig et al. hypothesized that this may be because:
the potential energy of excited helium atoms (the first level is at 19.8 eV) is almost twice that of argon (the first level is 11.6 eV), meaning that for the same dissipated energy, almost twice the number of metastable atoms in argon compared to helium can be created.
the quenching of excited states of CO2 by collisions with argon is less efficient compared to helium;
a better coupling of the electric field to energize the electron distribution function at low energies may allow a better vibrational excitation of CO2.
In our case, the dissociation via vibrational pumping of CO2 along the asymmetric mode was negligible since the excitation frequency was in the kHz range. This means that the second and third hypotheses of Stewig et al. do not apply here. However, the first hypothesis would be applicable, but as our measures showed that the nature of the carrier gas did not have an impact on the CO2 dissociation (Fig. 11), the role of excited noble gas atoms in CO2 dissociation can be questioned. To figure this out, an investigation on these excited noble gas atoms and more especially on metastable atoms is required and will be the subject of future work.
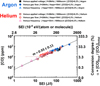 |
Fig. 11 Carbon monoxide (CO) concentration (left) and conversion degree of CO2 into CO (right) in Helium/CO2 ({99.7/0.3} %) and Argon/CO2 ({99.7/0.3} %) plasma as a function of the specific energy input (SEI) in log-log scale. |
 |
Fig. 12 Concentration of the energetic particles (excited noble gas atoms or/and electrons), X*, as a function of time. Figure (a) is the hypothesized concentration according to the literature and figure (b) is an approximation of figure (a). |
 |
Fig. 13 Carbon monoxide (CO) concentration (left) and conversion degree of CO2 into CO (right) in Helium/CO2 ({99.7/0.3} %) and Argon/CO2 ({99.7/0.3} %) plasma as a function of the specific energy input (SEI) in linear scale. |
3.2.2 Influence of the CO2 ratio
To evaluate the role of CO2 ratio in the carrier gas, we measured the CO concentration as a function of the CO2 admixture at a fixed SEI. As shown in Figure 11, comparable CO2 conversion was obtained in argon and helium from 50 to 110 J/l (130 × 10−4−290 × 10−4 eV/(atom or molecule)) for the chosen configuration of parameters. In order to have the ignition of both helium and argon plasma for a large CO2 concentration range, we chose as SEI a value of 172 J/l ± 3 J/l (447 ± 8 × 10⁻⁴ eV/(atom or molecule)). To obtain this value we set the gas flow rate at 500 sccm with a frequency of 20 kHz and we modulated the applied voltage between 9 kV and 13 kV.
Figure 14 presents the concentration of CO produced by plasma in argon and helium as a function of the CO2 admixture, while Figure 15 shows the conversion degree. Taking into account the error bars, the trends for argon and helium are comparable, which confirms the fact that the type of noble carrier gas did not play a significant role in CO2 conversion.
Figure 14 shows that the CO concentration increased with the CO2 admixture. Note that at ratios higher than 0.4 % of CO2, there were no data points in argon, since plasma ignition was not possible. For the chosen SEI, although CO concentration increased with CO2 admixture, the conversion decreased as presented in Figure 15. The main reason for this was probably the energy loss of electrons in the rotational-vibrational states of CO2, which implies a decrease of highly energetic electrons able to dissociate CO2.
Douat et al. measured a CO2 conversion in the range of 7.5–10.2% in a plasma jet fed with helium gas with an admixture of 1 % of CO2 and a SEI of 91 J/l [27] . When choosing the exact same parameters (gas mixture and SEI) with the present setup, we found a conversion degree in the range of 4–7%. The power supply was the same as in Douat et al., but the geometry of the plasma reactor was different. In the case of Douat et al., the powered electrode was in direct contact with the plasma, while in the present study it was separated by a glass tube. As the powered electrode was not in direct contact with the plasma, for the same applied voltage, the electric field in the gas area was reduced due to the distance imposed by the presence of the glass tube between the electrode and the gas to be ionized. As a result, more energy was required for plasma ignition and the CO2 conversion was less efficient than with a plasma reactor with the powered electrode in direct contact with the plasma. Even if a direct contact of the powered electrode with the plasma enhances the CO2 conversion, it represents a drawback for biological applications, since arc prevention with the biological target is not guaranteed, especially with argon as a carrier gas.
Finally, helium and argon as carrier gases are equivalent in terms of CO production, but some differences can be noted concerning the electrical characterization. Helium requires less energy to ignite the plasma, which is an advantage for practical purposes since it is safer to use a lower applied voltage, but argon is definitely cheaper than helium and its abundance makes it more attractive for economic and ecological reasons.
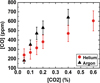 |
Fig. 14 CO concentration produced in Helium/CO2 and Argon/CO2 plasma as a function of CO2 concentration. The data were recorded at 20 kHz with a total gas flow rate of 500 sccm, for a specific energy input (SEI) of 172 J/l. |
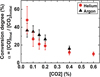 |
Fig. 15 Conversion of CO2 into CO in Helium/CO2 and Argon/CO2 plasma as a function of CO2 concentration. The data were recorded at 20 kHz with a total gas flow rate of 500 sccm, for a specific energy input (SEI) of 172 J/l. |
4 Conclusion
Carbon monoxide (CO) has anti-inflammatory properties and its production by plasma could be a significant advantage in the field of plasma medicine especially for inflammatory diseases. In this context, we characterized a pulsed kHz-driven plasma jet able to produce CO for biomedical applications. The CO2 conversion into CO, the breakdown voltage and energy delivered to the plasma were investigated for two noble carrier gases: helium and argon.
The breakdown voltage and energy consumption in argon gas were twice as high as in helium. The breakdown voltage occurred at 4 kV for helium while it occurred between 8 and 10 kV in argon with the addition of 0.3% CO2. This difference was due to a higher ionization coefficient in helium than in argon. As a result, the energy delivered to the plasma in argon was twice that in helium and we showed that this energy increased linearly with the applied voltage. The breakdown voltage was barely affected by the gas flow rate and the applied voltage, while it decreased slightly with the excitation frequency because the amount of residual charges increases with the frequency.
The concentration of CO produced by plasma was measured by absorption spectrometry via a gas analyzer. The production of CO by plasma rose from a couple of ppm to about 2000 ppm for a specific energy input in the range of 2–190 J/L (= 5 × 10⁻⁴–5000 × 10−4 eV/(atom or molecule)). This concentration is comparable to the one used in CO inhalation clinical trials, which means that this plasma source is safe in terms of CO production.
Unlike literature results on CO2 dissociation in helium and argon as carrier gases, comparable CO2 conversion degrees were obtained for the two noble gases, showing that the nature of the carrier noble gas did not have an impact on it, even though the plasma exhibited different features in helium and argon. In log-log scale, the concentration of CO produced by plasma as a function of the SEI with the addition of 0.3% CO2 followed a linear trend up to 200 J/l and reached a plateau at about 70%. The slope of the straight line was 0.93 ± 0.11, meaning that [CO]∝SEI0.93. As this slope was very close to one, it implies that loss processes were negligible and that CO2 dissociation was mainly due to energetic particles (electrons and excited noble gas atoms), whereas the precise role of metastable atoms remains to be clarified. The ratio of CO2 in the gas mixture also had an impact on the CO concentration and increased with it while the CO2 conversion degree decreased. Thus, SEI and the ratio of CO2 in the gas mixture were the two scaling parameters for CO production regardless of the nature of the carrier gas.
Finally, CO is a stable molecule and there was no backward reaction to CO2 in our conditions. Helium and argon as carrier gases are equivalent in terms of CO production and the CO concentration can be controlled by the specific energy input (SEI) and the ratio of CO2 in the gas mixture.
Acknowledgments
The authors would like to thank the French Research Agency (ANR) for funding this research (MediCO-Plasma | ANR-21-CE19-0005).
Funding
This research was funded by the French Research Agency (ANR) (MediCO-Plasma | ANR-21-CE19-0005).
Conflicts of interest
We confirm that this work is original and has not been published elsewhere, nor is it currently under consideration for publication elsewhere.
The authors have nothing to disclose.
Date availability statement
The data that support the findings of this study are available from the corresponding author, EM, upon reasonable request.
Author contribution statement
Conceptualization: C.D.; Writing − Original draft preparation: E.M., C.D., T.G.; Methodology and data interpretation: E.M., C.D.; Data acquisition: E.M.; Design of the power supply: S.D.; Writing review and editing: E.M., C.D., T.G. All authors discussed the results, reviewed the manuscript, and have read and agreed to the published version of the manuscript.
References
- P.J. Bruggeman, F. Iza, R. Brandenburg, Foundations of atmospheric pressure non-equilibrium plasmas, Plasma Sources Sci. Technol. 26, 123002 (2017). https://doi.org/10.1088/1361-6595/aa97af [Google Scholar]
- M. López et al., A review on non-thermal atmospheric plasma for food preservation: mode of action, determinants of effectiveness, and applications, Front. Microbiol. 10, 622 (2019). https://doi.org/10.3389/fmicb.2019.00622 [CrossRef] [Google Scholar]
- G. Divya Deepak, Review on recent advances in cold plasma technology, Eur. Phys. J. Appl. Phys. 97, 39 (2022). https://doi.org/10.1051/epjap/2022210275 [CrossRef] [EDP Sciences] [Google Scholar]
- M. Domonkos, P. Tichá, J. Trejbal, P. Demo, Applications of cold atmospheric pressure plasma technology in medicine, agriculture and food industry, Appl. Sci. 11, 4809 (2021). https://doi.org/10.3390/app11114809 [CrossRef] [Google Scholar]
- A.K. Martusevich, A.V. Surovegina, I.V. Bocharin, V.V. Nazarov, I.A. Minenko, M. Yu. Artamonov, Cold argon athmospheric plasma for biomedicine: biological effects, applications and possibilities, Antioxidants 11, 1262 (2022). https://doi.org/10.3390/antiox11071262 [CrossRef] [PubMed] [Google Scholar]
- F. Judée, J. Vaquero, S. Guégan, L. Fouassier, T. Dufour, Atmospheric pressure plasma jets applied to cancerology: correlating electrical configuration with in vivo toxicity and therapeutic efficiency, J. Phys. D. 52, 245201 (2019). https://doi.org/10.1088/1361-6463/ab0fbb [CrossRef] [Google Scholar]
- M. Mateu-Sanz, M.-P. Ginebra, J. Tornín, C. Canal, Cold atmospheric plasma enhances doxorubicin selectivity in metastasic bone cancer, Free Radic. Biol. Med. 189, 32 (2022). https://doi.org/10.1016/j.freeradbiomed.2022.07.007 [CrossRef] [Google Scholar]
- R. Limanowski, D. Yan, L. Li, M. Keidar, Preclinical cold Aatmospheric plasma cancer treatment, Cancers 14, 3461 (2022). https://doi.org/10.3390/cancers14143461 [CrossRef] [PubMed] [Google Scholar]
- A.C. Borges et al., Applications of cold atmospheric pressure plasma in dentistry, Appl. Sci. 11, 1975 (2021). https://doi.org/10.3390/app11051975 [CrossRef] [Google Scholar]
- S. Bekeschus, B. Poschkamp, J. van der Linde, Medical gas plasma promotes blood coagulation via platelet activation, Biomaterials 278, 120433 (2021). https://doi.org/10.1016/j.biomaterials.2020.120433 [CrossRef] [PubMed] [Google Scholar]
- T. Bernhardt, M.L. Semmler, M. Schäfer, S. Bekeschus, S. Emmert, L. Boeckmann, Plasma medicine: applications of cold atmospheric pressure plasma in dermatology, Oxid. Med. Cell. Longev. 2019, 1 (2019). https://doi.org/10.1155/2019/3873928 [CrossRef] [Google Scholar]
- T. Maho et al., Anti-bacterial action of plasma multi-jets in the context of chronic wound healing, Appl. Sci. 11, 9598 (2021). https://doi.org/10.3390/app11209598 [CrossRef] [Google Scholar]
- S. Bekeschus, T. von Woedtke, S. Emmert, A. Schmidt, Medical gas plasma-stimulated wound healing: evidence and mechanisms, Redox Biol. 46, 102116 (2021). https://doi.org/10.1016/j.redox.2021.102116 [CrossRef] [Google Scholar]
- D.B. Graves, The emerging role of reactive oxygen and nitrogen species in redox biology and some implications for plasma applications to medicine and biology, J. Phys. D 45, 263001 (2012). https://doi.org/10.1088/0022-3727/45/26/263001 [CrossRef] [Google Scholar]
- A. Soneja, M. Drews, T. Malinski, Role of nitric oxide, nitroxidative and oxidative stress in wound healing, Pharmacol. Rep. 12, 108 ( 2005) [Google Scholar]
- R. Foresti, M.G. Bani-Hani, R. Motterlini, Use of carbon monoxide as a therapeutic agent: promises and challenges, Intensive Care Med. 34, 649 (2008). https://doi.org/10.1007/s00134-008-1011-1 [CrossRef] [PubMed] [Google Scholar]
- L.D. Prockop, R.I. Chichkova, Carbon monoxide intoxication: an updated review, J. Neurol. Sci. 262, 122 (2007). https://doi.org/10.1016/j.jns.2007.06.037 [CrossRef] [Google Scholar]
- E. Carbone, C. Douat, Carbon monoxide in plasma medicine and agriculture: just a foe or a potential friend?, Plasma Med. 8, 93 (2018). https://doi.org/10.1615/PlasmaMed.2018024519 [CrossRef] [Google Scholar]
- R. Motterlini, L.E. Otterbein, The therapeutic potential of carbon monoxide, Nat. Rev. Drug. Discov. 9, 728 (2010). https://doi.org/10.1038/nrd3228 [CrossRef] [PubMed] [Google Scholar]
- S. Minegishi et al., Detection and removal of endogenous carbon monoxide by selective and cell-permeable hemoprotein model complexes, J. Am. Chem. Soc. 139, 5984 (2017). https://doi.org/10.1021/jacs.7b02229 [CrossRef] [PubMed] [Google Scholar]
- R. Motterlini, R. Foresti, Biological signaling by carbon monoxide and carbon monoxide-releasing molecules, Am. J. Physiol. Cell Physiol. 312, C302 (2017). https://doi.org/10.1152/ajpcell.00360.2016 [CrossRef] [PubMed] [Google Scholar]
- B.E. Mann, R. Motterlini, CO and NO in medicine, Chem. Commun. 4197 (2007). https://doi.org/10.1039/B704873D [Google Scholar]
- A. Fridman, Plasma Chem. 5, 260 (2008) [CrossRef] [Google Scholar]
- M.A.K. Khalil, R.A. Rasmussen, The global cycle of carbon monoxide: trends and mass balance, Chemosphere 20, 227 (1990). https://doi.org/10.1016/0045-6535(90)90098-E [CrossRef] [Google Scholar]
- R. Snoeckx, A. Bogaerts, Plasma technology ? a novel solution for CO2 conversion?, Chem. Soc. Rev. 46, 5805 (2017). https://doi.org/10.1039/C6CS00066E [Google Scholar]
- F. Brehmer, S. Welzel, M.C.M. van de Sanden, R. Engeln, CO and byproduct formation during CO2 reduction in dielectric barrier discharges, J. Appl. Phys. 116, 123303 (2014). https://doi.org/10.1063/1.4896132 [CrossRef] [Google Scholar]
- C. Douat, P. Escot Bocanegra, S. Dozias, É. Robert, R. Motterlini, Production of carbon monoxide from a He/CO2 plasma jet as a new strategy for therapeutic applications, Plasma Process. Polym. 18, 9 (2021). https://doi.org/10.1002/ppap.202100069 [CrossRef] [Google Scholar]
- A. Sobota, O. Guaitella, A. Rousseau, The influence of the geometry and electrical characteristics on the formation of the atmospheric pressure plasma jet, Plasma Sources Sci. Technol. 23, 025016 (2014). https://doi.org/10.1088/0963-0252/23/2/025016 [CrossRef] [Google Scholar]
- J. Benedikt, V. Raballand, A. Yanguas-Gil, K. Focke, A. von Keudell, Thin film deposition by means of atmospheric pressure microplasma jet, Plasma Phys. Control. Fusion 49, B419 (2007). https://doi.org/10.1088/0741-3335/49/12B/S39 [CrossRef] [Google Scholar]
- I.P. Raĭzer, Gas Discharge Physics (Springer, Berlin, 1997) [Google Scholar]
- T. Yoshinaga, H. Akashi, Effects of metastable atoms on breakdown voltage in Argon DBD, J. Phys.: Conf. Ser. 441, 012013 (2013). https://doi.org/10.1088/1742-6596/441/1/012013 [CrossRef] [Google Scholar]
- A.A. Knizhnik et al., Experimental study of the process of inner treatment of porous polylactide in a pulsed DBD, AIP Adv. 11, 095302 (2021). https://doi.org/10.1063/5.0059564 [CrossRef] [Google Scholar]
- G.D. Deepak, N.K. Joshi, R. Prakash, U. Pal, Electrical characterization of argon and nitrogen based cold plasma jet, Eur. Phys. J. Appl. Phys. 83, 20801 (2018). https://doi.org/10.1051/epjap/2018180057 [CrossRef] [EDP Sciences] [Google Scholar]
- D.Y. Kim, S.J. Kim, H.M. Joh, T.H. Chung, Characterization of an atmospheric pressure plasma jet array and its application to cancer cell treatment using plasma activated medium, Phys. Plasmas 25, 073505 (2018). https://doi.org/10.1063/1.5037249 [CrossRef] [Google Scholar]
- J. Kriegseis, B. Möller, S. Grundmann, C. Tropea, Capacitance and power consumption quantification of dielectric barrier discharge (DBD) plasma actuators, J. Electrostat. 69, 302 (2011). https://doi.org/10.1016/j.elstat.2011.04.007 [CrossRef] [Google Scholar]
- T. Teschner, R. Bansemer, K.-D. Weltmann, Investigation of power transmission of a helium plasma jet to different dielectric targets considering operating modes, T. Gerling, Plasma 2, 348 (2019). https://doi.org/10.3390/plasma2030027 [CrossRef] [Google Scholar]
- S. Ponduri, R. Engeln, M.M. Becker, S. Welzel, M.C.M. van de Sanden, D. Loffhagen, Fluid modelling of CO2 dissociation in a dielectric barrier discharge, J. Appl. Phys. 119, 093301 (2016). https://doi.org/10.1063/1.4941530 [CrossRef] [Google Scholar]
- G.V. Naidis, Modelling of streamer propagation in atmospheric-pressure helium plasma jets, Modelling of streamer propagation in atmospheric-pressure helium plasma jets, J. Phys. D 43, 402001 (2010). https://doi.org/10.1088/0022-3727/43/40/402001 [CrossRef] [Google Scholar]
- B. Niermann, M. Böke, N. Sadeghi, J. Winter, Space resolved density measurements of argon and helium metastable atoms in radio-frequency generated He-Ar micro-plasmas, Eur. Phys. J. D 60, 489 (2010). https://doi.org/10.1140/epjd/e2010-00166-8 [CrossRef] [Google Scholar]
- F. Massines, A. Rabehi, P. Decomps, R.B. Gadri, P. Ségur, C. Mayoux, Experimental and theoretical study of a glow discharge at atmospheric pressure controlled by dielectric barrier, J. Appl. Phys. 83, 2950 (1998). https://doi.org/10.1063/1.367051 [CrossRef] [Google Scholar]
- J.M. Williamson, D.D. Trump, P. Bletzinger, B.N. Ganguly, Comparison of high-voltage ac and pulsed operation of a surface dielectric barrier discharge, J. Phys. D 39, 4400 (2006). https://doi.org/10.1088/0022-3727/39/20/016 [CrossRef] [Google Scholar]
- P. Bletzinger, B.N. Ganguly, The effect of displacement current on fast-pulsed dielectric barrier discharges, J. Phys. D 36, 1550 (2003). https://doi.org/10.1088/0022-3727/36/13/318 [CrossRef] [Google Scholar]
- G.J.M. Hagelaar, L.C. Pitchford, Solving the Boltzmann equation to obtain electron transport coefficients and rate coefficients for fluid models, Plasma Sources Sci. Technol. 14, 722 (2005). https://doi.org/10.1088/0963-0252/14/4/011 [NASA ADS] [CrossRef] [Google Scholar]
- A.V. Phelps et al., Phelps database. www.lxcat.net/Phelps [Google Scholar]
- T. Darny, J.-M. Pouvesle, V. Puech, C. Douat, S. Dozias, E. Robert, Analysis of conductive target influence in plasma jet experiments through helium metastable and electric field measurements, Plasma Sources Sci. Technol. 26, 045008 (2017). https://doi.org/10.1088/1361-6595/aa5b15 [CrossRef] [Google Scholar]
- D. Breden, K. Miki, L.L. Raja, Self-consistent two-dimensional modeling of cold atmospheric-pressure plasma jets/bullets, Plasma Sources Sci. Technol. 21, 034011 (2012). https://doi.org/10.1088/0963-0252/21/3/034011 [CrossRef] [Google Scholar]
- X.-J. Shao, N. Jiang, G.-J. Zhang, Z. Cao, Comparative study on the atmospheric pressure plasma jets of helium and argon, Appl. Phys. Lett. 101, 253509, (2012). https://doi.org/10.1063/1.4772639 [Google Scholar]
- A. Bogaerts et al., The 2020 plasma catalysis roadmap, J. Phys. D 53, 443001 (2020). https://doi.org/10.1088/1361-6463/ab9048 [CrossRef] [Google Scholar]
- U. Goebel, J. Wollborn, Carbon monoxide in intensive care medicine—time to start the therapeutic application?!, ICMx 8, 2 (2020). https://doi.org/10.1186/s40635-020-0292-8 [CrossRef] [Google Scholar]
- C. Stewig, S. Schüttler, T. Urbanietz, M. Böke, A. von Keudell, Excitation and dissociation of CO2 heavily diluted in noble gas atmospheric pressure plasma, J. Phys. D. 53, 125205 (2020). https://doi.org/10.1088/1361-6463/ab634f [CrossRef] [Google Scholar]
- R. Aerts, T. Martens, A. Bogaerts, Influence of vibrational states on CO2 splitting by dielectric barrier discharges, J. Phys. Chem. C 116, 23257 (2012). https://doi.org/10.1021/jp307525t [CrossRef] [Google Scholar]
- C. Douat, I. Kacem, N. Sadeghi, G. Bauville, M. Fleury, V. Puech, Space-time resolved density of helium metastable atoms in a nanosecond pulsed plasma jet: influence of high voltage and pulse frequency, J. Phys. D 49, 285204 (2016). https://doi.org/10.1088/0022-3727/49/28/285204 [CrossRef] [Google Scholar]
- W.M. Haynes, D.R. Lide, T.J. Bruno, CRC Handbook of Chemistry and Physics 97th ed. (CRC Press, 2016). https://doi.org/10.1201/9781315380476 [Google Scholar]
- R. Aerts, W. Somers, A. Bogaerts, Carbon Dioxide Splitting in a Dielectric Barrier Discharge Plasma: A Combined Experimental and Computational Study, Chem. Sus. Chem. 8, 702 (2015). https://doi.org/10.1002/cssc.201402818 [CrossRef] [PubMed] [Google Scholar]
- K. McKay, J.-S. Oh, J.L. Walsh, J.W. Bradley, Mass spectrometric diagnosis of an atmospheric pressure helium microplasma jet, J. Phys. D 46, 464018 (2013). https://doi.org/10.1088/0022-3727/46/46/464018 [Google Scholar]
- T. Darny, J.-M. Pouvesle, J. Fontane, L. Joly, S. Dozias, E. Robert, Plasma action on helium flow in cold atmospheric pressure plasma jet experiments, Plasma Sources Sci. Technol. 26, 105001 (2017). https://doi.org/10.1088/1361-6595/aa8877 [CrossRef] [Google Scholar]
- S. Nijdam, J. Teunissen, U. Ebert, The physics of streamer discharge phenomena, Plasma Sources Sci. Technol. 29, 103001 (2020). https://doi.org/10.1088/1361-6595/abaa05 [CrossRef] [Google Scholar]
- J. Golda, F. Kogelheide, P. Awakowicz, V.S. der Gathen, Dissipated electrical power and electron density in an RF atmospheric pressure helium plasma jet, Plasma Sources Sci. Technol. 28, 095023 (2019). https://doi.org/10.1088/1361-6595/ab393d [CrossRef] [Google Scholar]
- M. Qian, C. Ren, D. Wang, J. Zhang, G. Wei, Stark broadening measurement of the electron density in an atmospheric pressure argon plasma jet with double-power electrodes, J. Appl. Phys. 107, 063303 (2010). https://doi.org/10.1063/1.3330717 [CrossRef] [Google Scholar]
- C. Douat et al., The role of the number of filaments in the dissociation of CO 2 in dielectric barrier discharges, Plasma Sources Sci. Technol. 32, 055001 (2023). https://doi.org/10.1088/1361-6595/acceca [CrossRef] [Google Scholar]
- J. Dedrick et al., Self-limiting trade-off between CO yield and CO2 conversion energy efficiency in atmospheric pressure radio-frequency plasmas: picosecond laser spectroscopy, in Bulletin of the American Physical Society, 75th Annual Gaseous Electronics Conference, Oct. 04, 2022. (APS, 2022) https://meetings.aps.org/Meeting/GEC22/Session/FT2.1 [Google Scholar]
- M. Ramakers, I. Michielsen, R. Aerts, V. Meynen, A. Bogaerts, Effect of argon or helium on the CO2 conversion in a dielectric barrier discharge: effect of argon or helium on the CO2 conversion in a dielectric barrier discharge, Plasma Process. Polym. 12, 755 (2015). https://doi.org/10.1002/ppap.201400213 [CrossRef] [Google Scholar]
Cite this article as: Eloïse Mestre, Titaïna Gibert, Sébastien Dozias, Claire Douat, Comparison of helium and argon for the production of carbon monoxide (CO) by a plasma jet for biomedical applications, Eur. Phys. J. Appl. Phys. 99, 13 (2024)
All Figures
|
Fig. 1 Schematic (left) and picture (right) of the experimental setup. |
| In the text | |
|
Fig. 2 High-voltage waveform of one pulse. |
| In the text | |
|
Fig. 3 Applied voltage waveform (Black-left) and discharge current waveform (Red-right). The breakdown voltage, Vbd, was estimated at 10% of the maximum value of the discharge current. |
| In the text | |
|
Fig. 4 Instantaneous power and its corresponding temporal integration equal to the energy delivered to the plasma (E). Vapp = 10 kV, freq = 20 kHz, helium flow rate = 1000 sccm. |
| In the text | |
|
Fig. 5 Lissajous figure. Vapp = 10 kV, freq = 20 kHz, helium flow rate = 1000 sccm. |
| In the text | |
|
Fig. 6 Breakdown voltage (Vbd) and energy delivered to the plasma (E) in Helium/CO2 ({99.7/0.3} %) or Argon/CO2 ({99.7/0.3} %) plasma versus the frequency. The data were recorded at 10 kV with a total gas flow rate of 1000 sccm. |
| In the text | |
|
Fig. 7 Breakdown voltage (Vbd) and energy delivered to the plasma (E) in Helium/CO2 ({99.7/0.3} %) or Argon/CO2 ({99.7/0.3} %) plasma versus the total gas flow rate. The data were recorded at 10 kV and 20 kHz. |
| In the text | |
|
Fig. 8 Breakdown voltage (Vbd) and energy delivered to the plasma (E) in Helium/CO2 ({99.7/0.3} %) or Argon/CO2 ({99.7/0.3} %) plasma versus the applied voltage. The data were recorded at 20 kHz with a total gas flow rate of 1000 sccm. |
| In the text | |
|
Fig. 9 Ionization coefficient as a function of the reduced electric field in pure helium and pure argon discharge. From Boltzig+. |
| In the text | |
|
Fig. 10 Temporal representation of the discharge current in Helium/CO2 ({99.7/0.3} %) or Argon/CO2 ({99.7/0.3} %). The data were recorded at 20 kHz with a total gas flow rate of 1000 sccm and a frequency of 20 kHz. |
| In the text | |
|
Fig. 11 Carbon monoxide (CO) concentration (left) and conversion degree of CO2 into CO (right) in Helium/CO2 ({99.7/0.3} %) and Argon/CO2 ({99.7/0.3} %) plasma as a function of the specific energy input (SEI) in log-log scale. |
| In the text | |
|
Fig. 12 Concentration of the energetic particles (excited noble gas atoms or/and electrons), X*, as a function of time. Figure (a) is the hypothesized concentration according to the literature and figure (b) is an approximation of figure (a). |
| In the text | |
|
Fig. 13 Carbon monoxide (CO) concentration (left) and conversion degree of CO2 into CO (right) in Helium/CO2 ({99.7/0.3} %) and Argon/CO2 ({99.7/0.3} %) plasma as a function of the specific energy input (SEI) in linear scale. |
| In the text | |
|
Fig. 14 CO concentration produced in Helium/CO2 and Argon/CO2 plasma as a function of CO2 concentration. The data were recorded at 20 kHz with a total gas flow rate of 500 sccm, for a specific energy input (SEI) of 172 J/l. |
| In the text | |
|
Fig. 15 Conversion of CO2 into CO in Helium/CO2 and Argon/CO2 plasma as a function of CO2 concentration. The data were recorded at 20 kHz with a total gas flow rate of 500 sccm, for a specific energy input (SEI) of 172 J/l. |
| In the text | |
Current usage metrics show cumulative count of Article Views (full-text article views including HTML views, PDF and ePub downloads, according to the available data) and Abstracts Views on Vision4Press platform.
Data correspond to usage on the plateform after 2015. The current usage metrics is available 48-96 hours after online publication and is updated daily on week days.
Initial download of the metrics may take a while.