| Issue |
Eur. Phys. J. Appl. Phys.
Volume 80, Number 1, October 2017
Plasma Sources and Plasma Processes (PSPP)
|
|
|---|---|---|
| Article Number | 10801 | |
| Number of page(s) | 4 | |
| Section | Plasma, Discharges and Processes | |
| DOI | https://doi.org/10.1051/epjap/2017170189 | |
| Published online | 06 October 2017 | |
https://doi.org/10.1051/epjap/2017170189
Regular Article
Densities of Active species in N2/H2 RF and HF afterglows: application to surface nitriding of TiO2 nanocrystals★
1
LAPLACE, Université de Toulouse, CNRS, INPT, UPS, 118 route de Narbonne, 31062 Toulouse, France
2
Department of Chemistry and Department of Energy System Research, Ajou University, Suwon 443-749, South Korea
* e-mail: ricard@laplace.univ-tlse
Received:
1
June
2017
Received in final form:
4
September
2017
Accepted:
15
September
2017
Published online: 6 October 2017
N2/0–5% H2 flowing afterglows from Radio Frequency (RF) and High Frequency (HF) sources have been analyzed by optical emission spectroscopy. In similar conditions (pressure 5–6 Torr, flow rate 0.5 slm and power 100 W), it is found in pure N2 a nearly constant N-atom density from the pink to the late afterglow, which is higher in HF than in RF: (1–2) and 0.4 × 1015 cm−3, respectively. With a N2/2% H2 gas mixture, the early afterglows is changed to a late afterglow with about the same N-atom density for both RF and HF cases: (8–9) × 1014 cm−3. Anatase TiO2 nanocrystals and Atomic Layer Deposition-grown films were exposed to the RF afterglows at room temperature. XPS analysis of the samples has shown that the highest N/Ti ratio of 0.24 can be achieved with the pure N2 late afterglow. In the HF pure N2 late afterglow, however, the N/Ti coverage was limited to 0.04 in spite of higher N-atom density. Such differences in the N content between the two RF and HF cases are attributed to the presence of a high O-atom impurity of 2 × 1013 cm−3 in HF as compared to that (8 × 1011 cm−3) in RF.
© EDP Sciences, 2017
1 Introduction
N2 plasmas have been frequently used for the surface nitridation of metals and oxides for various applications [1,2]. For the case of TiO2, N2 plasma can be used to make oxynitride layers within the TiO2 matrix for enhanced visible light absorption and subsequent enhancement in photocatalytic activity [2]. However, the high temperature and the high density of ions and electrons in the plasmas may induce undesirable defects within the TiO2 matrix that can induce a negative effect in the resulting photocatalytic performances. As an alternative damage-free strategy in the nitridation of TiO2, afterglows or the post-discharge regions of N2 plasmas can be used for a selective nitridation of TiO2 surface since the densities of ions and electrons are much lower in the afterglows than in the plasmas [3].
With such a purpose in mind, we compare the afterglows of N2 plasmas generated by two different excitation sources of High Frequency 2450 MHz (HF) and Radio Frequency 13.6 MHz (RF) in this study. Such a comparison was started in N2 and Ar–N2 flowing plasmas [4] showing that the RF discharge is more vibrationally excited than the HF one. As a consequence, it is produced more high N2(X,v) vibrational levels in RF than in HF and then a more intense pink afterglow in RF.
The two setups A and B used in this work are similar with about same discharge tube inner dia. 6 (A) and 5 (B) mm and afterglow tube inner dia. 21 (A) and 18 (B) mm, same gas pressure (5–8 Torr), flow rate (0.5–1 slm), power (100–150 W). The most significant difference between the setup A and B is in the oxygen impurity as demonstrated hereafter. Previous results have been obtained in N2 and N2–H2 flowing RF [5] and HF afterglows [6,7]. By analyzing the radial distribution of the N2 1st pos (580 nm) system in the RF afterglow [5], it has been shown that the early afterglow changed from a pink to a late afterglow by introducing very small amounts of H2 (from 10−5 to 10−3) into N2.
The kinetic reactions in the early and late afterglows involving the N atoms, the N2(X,v) vibrationally excited ground state, the N2(A) metastable molecules and the N2+ ions have been previously studied in pure N2 [8–10]. In RF and HF flowing afterglows, N-atoms densities have been measured by NO titration. The concentrations of O-atoms (due to the presence of oxygen species in the impurities of the gas tank), of N2(A) and N2(X,v > 13) metastable molecules and of N2+ ions were determined from band-ratio intensities [11]. Concentrations of N-atoms, O-atoms in impurity, N2(X,v > 13) and N2(A) metastable molecules and N2+ ions were monitored in N2/<5% H2 RF and HF afterglows.
2 Experimental setup
The experimental set-ups of the RF and HF plasmas and afterglows are reproduced in Figure 1 [4]. The discharge quartz tubes have nearly the same inner diameters (ID) of 6 mm for the RF plasma and 5 mm for the HF plasma and have a length of 30 cm in RF and 16 cm in HF.
In the post-discharge region, the RF discharge tube is connected to a straight quartz tube of 21 mm ID (Fig. 1a) while the HF discharge tube is connected to a bent quartz tube of 18 mm ID itself connected to a 5 L Pyrex chamber (Fig. 1c).
The RF plasma is produced between two rings separated by 2 cm in the tube of 6 mm ID. The HF plasma is produced by a surfatron cavity [5]. In RF, with a N2 flow rate Q = 1 slm, a pressure p = 8 Torr and an incident power of 100 W, a pink (early) afterglow extends on 15 cm in the 21 mm i.d. tube (from z = 32 cm to z = 47 cm, see Fig. 1a and b), followed by a late afterglow (after z = 48 cm). In HF, a pink afterglow is observed in the bent part of the 18 mm tube with a N2 flow rate of 0.5 slm, a pressure p = 5 Torr and an incident power of 100 W. The NO titration of N-atoms in the RF and HF late afterglows was performed by introducing an Ar–1.5%NO flow after the pink afterglows. At 8 Torr, 0.5 slm and 100 W, it was previously obtained N-atom densities of 1.0 and 2.0, 1015 cm−3, for respectively, HF and RF N2 afterglow conditions [4].
The emission spectroscopy was performed by means of an optical fiber connected, in the RF set-up, to a Monera 500 spectrometer with 500 mm focal length, grating blazed at 500 nm, slits of 0.5 mm, resolution of 0.8 nm and a PMT (Hamamatsu R928 at 900 V). In the HF set-up, an optical fiber is connected to an Acton Spectra Pro 2500i spectrometer (grating 600 g/mm) equipped with a Pixis 256E CCD detector (front illuminated 1024 × 256 pixels).
The plasmas and the afterglows are characterized by the emission of the N2 1st pos system in the red part of the spectrum between 500 and 1100 nm and of the N2 2nd pos and N2+ 1st neg systems in the UV-blue part between 300 and 400 nm. The NOβ (320 nm) and NH (336 nm) emissions are also detected in the afterglows.
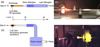 |
Fig. 1 Schematic diagrams and pictures of the RF (a and b) and the HF (c and d) set-ups A and B. In the RF (HF) set-up, the inner diameter of the quartz tube is 6 (5) mm in the discharge region and 21 (18) mm in the afterglow region. |
3 N2 pink and late afterglows
As reported in [11], densities of N-atoms, O-atoms in impurity, N2(X,v > 13) and N2(A) metastable molecules and N2+ ions can be obtained by the line-ratio intensity method after calibration of the N-atom density by NO titration. The results have been recently published [12] for the RF afterglow at 6 Torr, 0.6 slm, 100 W. The N-atom density kept a nearly constant value of 4 × 1014 cm−3 from the pink to the late afterglow as the density of N2(X,v > 13) molecules and the N2+ ions decreased from 8 to 1 (1013 cm−3) and from 2 to 0.4 (1010 cm−3), respectively. The O-atom density remained at (8–11) (1011 cm−3).
With the HF afterglow, it has been analyzed the afterglow from z = 25 to 50 cm in the tube of 18 mm i.d. (Fig. 1c). A pink afterglow was detected in the shoulder of the 18 mm i.d. tube between z = 17 and z = 25 cm. It is reported in Table 1 the N2 active species densities versus the distance z in the HF afterglow at 5 Torr, 0.5 slm, 100 W.
The value of N-atom density is indicated in Table 1. It has been found to be nearly constant from the pink to the late HF afterglow.
Comparing with the densities measured in the RF afterglow [12], the concentrations of N, O, N2(A) and N2+ are higher in the HF afterglow. The N2(A) and N2+ density are found to decrease from the pink to the late HF afterglow.
N2 active species densities determined in the HF afterglow of dia. 18 mm tube at 5 Torr, 0.5 slm, 100 W.
4 N2/<5%H2 plasma and early afterglow
As previously reported in [5], the RF pink afterglow disappeared when a few percent of H2 is added to N2. The rate coefficients of NH(A) excitation in the afterglow are unknown and therefore the line ratio intensity method [11] cannot be applied to determine the NH and H densities.
The P1/P2 intensity ratio between two rotational subbands of the N2 1st pos (2–0) vibrational transition at 775 nm can be related with the N2 rotational temperature TR, assumed to be equal to the gas temperature [4]. At 8 Torr, 0.5 slm and 100 W, it is found in the RF plasma an increase of TR from 700 to 900 K when the percentage of H2 introduced into N2 is increased from 0.2% to 5%.
Concentrations of the active species densities in the RF afterglow at z = 26 cm are given in reference [12]. The N2+ density is not reported since the N2+ ions disappeared with the H2 inlet.
The density of N-atoms remain almost constant when the H2% was increased from 0.2% to 5% in the N2/<5%H2 afterglows: [N] = (7–8) (1014 cm−3) but the O-atom density decreased from 8 to 2 (1013 cm−3). Otherwise, the N2(X,v > 13) density decreased significantly from 8 to 1 (1013 cm−3) as H2 was introduced into N2, explaining the disappearance of the pink afterglow in the N2/<5%H2 gas mixtures where they are produced by high N2(X,v > 13) vibrational Penning collisions [5,9].
In the HF afterglow, the condition of N2/2%H2, 5 Torr, 0.5 slpm, 100 W has been chosen. The active species densities were measured in the afterglow for 3 positions along the 18 mm i.d. tube z = 17, 25 and 50 cm and inside the 5 L reactor. The results are reported in Table 2. The N2(A) density could not be measured in the 5 L reactor as the I316 intensity was too weak. Moreover, the N2(X,v > 13) metastable and N2+ ion concentrations could not be obtained for z = 50 cm and in the 5 L reactor since the aN+N factor was found equal to 1 (pure late afterglow).
As observed in RF afterglows, the O-atom density strongly decreases by adding 2%H2 to N2. The decrease from 2 to 0.2 × 1013 cm−3 appears to be sensitive. Thus, one of the interest of the N2/<5%H2 gas mixture is for a surface treatment with reduced O-atom impurity.
N2/2%H2 active species densities determined in the HF afterglow at different z positions for 5 Torr, 0.5 slpm, 100 W.
5 TiO2/Si substrate treatments
By XPS analysis of TiO2 nanocrystals on Si samples treated by the N2 RF afterglow at 6 Torr, 0.6 slpm, 100 W, we obtained a N/Ti ratio of 0.22–0.24 when the sample was treated at z = 61 cm for 5 min in the N2 late afterglow. The ratio does not increase after a longer treatment time up to 60 min. In these conditions, the measured active species densities are [N] = 4 × 1014 cm−3, [O] = 8 × 1011 cm−3, [N2(A)] = 0.5 × 1011 cm−3, [N2(X,v>13)] = 1 × 1013 cm−3 and [N2+] = 0.4 × 1010 cm−3. On the other hand, in the N2 HF late afterglow at z = 35 cm, Q = 0.5 slm, p = 7 Torr and 150 W, the N/Ti coverage was limited to 0.04 in spite of higher N-atom density: (1–2) × 1015 cm−3. Such a dramatic difference in the nitriding performance between the RF and HF afterglows can be explained by higher O-atom impurity in HF: 2 × 1013 cm−3. The O/N ratios in the RF and HF afterglows were 2 × 10⁻³ and (1–2) × 10−2, respectively. Thus the high O/N ratio in the HF aterglows is related to the low N/Ti ratio.
In the pure N2 RF pink afterglow (aN+N = 0) at z = 26 cm, the N content was only 3–4%. The pink afterglow is characterized by a high N2+ density. With aN+N = 0, the N-atoms cannot be detected by the aN+N I580 intensity and the line-ratio method cannot be used. At the end of the pink afterglow, a N-atom density of (3–4) × 1014 cm−3 and a density of N2+ ions of 2 × 1010 cm−3 were measured [12]. It appears that a high N2+ density is detrimental to achieving a high N coverage.
In the RF N2/<5%H2 gas mixtures, the N content of 2–4% were obtained from the samples treated at z = 26 cm for the treatment times up to 60 min. At this point, the measured active species densities are [N] = 7–8 × 1014 cm−3, [O] = 2 × 1011 cm−3, [N2(A)] = 0.6 × 1011 cm−3 and [N2(X,v>13)] = 7–8 × 1013 cm−3. Compared with the pure N2 afterglow, densities of active species are higher in N2/<5%H2, except for the O-atoms. The addition of H2 in the plasma could produce NH radicals and H-atoms which appeared to be not effective for an efficient N/Ti coverage in spite of higher N-atom density.
Under the present treatment conditions with the N2 and N2–H2 afterglows, it can be concluded that treatment time of 5 min is sufficient for the saturation N coverage at room temperature (RT) for both RF and HF treatment conditions.
6 Conclusion
The RF N2 early afterglow in a tube of 21 mm i.d. was transformed into a pink with a part aN+N of N + N recombination between 0 and 0.1 to a late with aN+N = 0.8 when H2 was introduced between 0.2% and 5% into N2 at 8 Torr, 0.5 slm, 100 W. The pink afterglow was also observed after the HF N2 plasma in a tube of 18 mm i.d. at 5 Torr, 0.5 slm, 100 W which disappeared as 2% of H2 was introduced into N2.
In the N2–(0–5%)H2 gas mixtures of RF plasma, the N-atoms, N2(X,v > 13) and N2(A) metastable molecules kept a nearly constant value of (7–8) × 1014 cm−3, (7–12) × 1013 cm−3 and 6 × 1010 cm−3, respectively. The emission of the N2+ ions was too weak to be detected. The density of O-atoms in impurity decreased from 8 to 2 × 1011 cm−3. The N2/H2 gas mixtures appeared to be of interest to reduce the O-atom impurity in the afterglow for a surface treatment.
TiO2 samples in forms of anatase nanocrystals and Atomic Layer Deposition-grown thin films were exposed to the RF and HF afterglows at RT. XPS analysis has shown that TiO2 treated in the late afterglow of N2 RF plasma has the highest N content (N/Ti ratio of 0.24). The high N content achieved is attributed to the high N-atom density in the afterglow. Under the very similar operating conditions, the treatment in the HF N2 late afterglow resulted in low N/Ti ratios of 0.02–0.04 which was attributed to high O-atom impurity: O/N = 2 × 10⁻³ in RF and (1–2) × 10−2 in HF. Thus, it can be concluded that the densities of N and O atoms in the late afterglows play an important role in the surface nitriding performance of TiO2 for applications in photocatalysis.
However, the present conclusion applies only to the case when the substrate is just introduced to the flowing afterglows operating at RT. Under this condition, the substrate temperature remains close to RT throughout the whole treatment process. We are in the process of further in-depth XPS analysis on the surface nitriding performances of TiO2 with HF N2 and N2/<2%H2 afterglows at elevated substrate temperatures, which is beyond the scope of the present study.
Acknowledgment
This work was supported by the Franco-Korean Project PHC STAR 2015-2016 (34306TK).
References
- I. Bertóti, M. Mohai, J.L. Sullivan, S.O. Saied, Appl. Surf. Sci. 84, 357 (1995) [Google Scholar]
- A. Sasinska, D. Bialuschewski, M.M. Islam, T. Singh, M. Deo, S. Mathur, J. Phys. Chem. C 121, 15538 (2017) [CrossRef] [Google Scholar]
- A. Ricard, S.G. Oh, J. Jang, Y.K. Kim, Curr. Appl. Phys. 15, 1453 (2015) [Google Scholar]
- A. Ricard, J.-P. Sarrette, S.-G. Oh, Y.K. Kim, Plasma Chem. Plasma Process. 36, 1559 (2016) [CrossRef] [Google Scholar]
- A. Ricard, S.G. Oh, Plasma Sources Sci. Technol. 23, 045009 (2014) [Google Scholar]
- H. Zerrouki, A. Ricard, J.P. Sarrette, J. Phys. Conf. Ser. 550, 012045 (2014) [Google Scholar]
- M. Abdeladim, J.-P. Sarrette, A. Ricard, N.M. Maaza, Eur. Phys. J. Appl. Phys. 67, 10801 (2014) [CrossRef] [EDP Sciences] [Google Scholar]
- M. Mrázková, P. Vašina, V. Kudrle, A. Tálský, C.D. Pintassilgo, V. Guerra, J. Phys. D: Appl. Phys. 42, 075202 (2009) [CrossRef] [Google Scholar]
- V. Guerra, P.A. Sá, J. Loureiro, J. Phys. Conf. Ser. 63, 012007 (2007) [Google Scholar]
- J. Levaton, J. Amorim, A.R. Souza, D. Franco, A. Ricard, J. Phys. D: Appl. Phys. 35, 689 (2002) [CrossRef] [Google Scholar]
- A. Ricard, S.G. Oh, V. Guerra, Plasma Sources Sci. Technol. 22, 035009 (2013) [Google Scholar]
- Y. Wang, A. Ricard, J.-P. Sarrette, A. Kim, Y.K. Kim, Surf. Coat. Technol. 324, 243 (2017) [Google Scholar]
Cite this article as: André Ricard, Jean-Philippe Sarrette, Yunfei Wang, Yu-Kwon Kim, Densities of Active species in N2/H2 RF and HF afterglows: application to surface nitriding of TiO2 nanocrystals, Eur. Phys. J. Appl. Phys. 80, 10801 (2017)
All Tables
N2 active species densities determined in the HF afterglow of dia. 18 mm tube at 5 Torr, 0.5 slm, 100 W.
N2/2%H2 active species densities determined in the HF afterglow at different z positions for 5 Torr, 0.5 slpm, 100 W.
All Figures
|
Fig. 1 Schematic diagrams and pictures of the RF (a and b) and the HF (c and d) set-ups A and B. In the RF (HF) set-up, the inner diameter of the quartz tube is 6 (5) mm in the discharge region and 21 (18) mm in the afterglow region. |
| In the text | |
Current usage metrics show cumulative count of Article Views (full-text article views including HTML views, PDF and ePub downloads, according to the available data) and Abstracts Views on Vision4Press platform.
Data correspond to usage on the plateform after 2015. The current usage metrics is available 48-96 hours after online publication and is updated daily on week days.
Initial download of the metrics may take a while.