Open Access
Fig. 4
Download original image
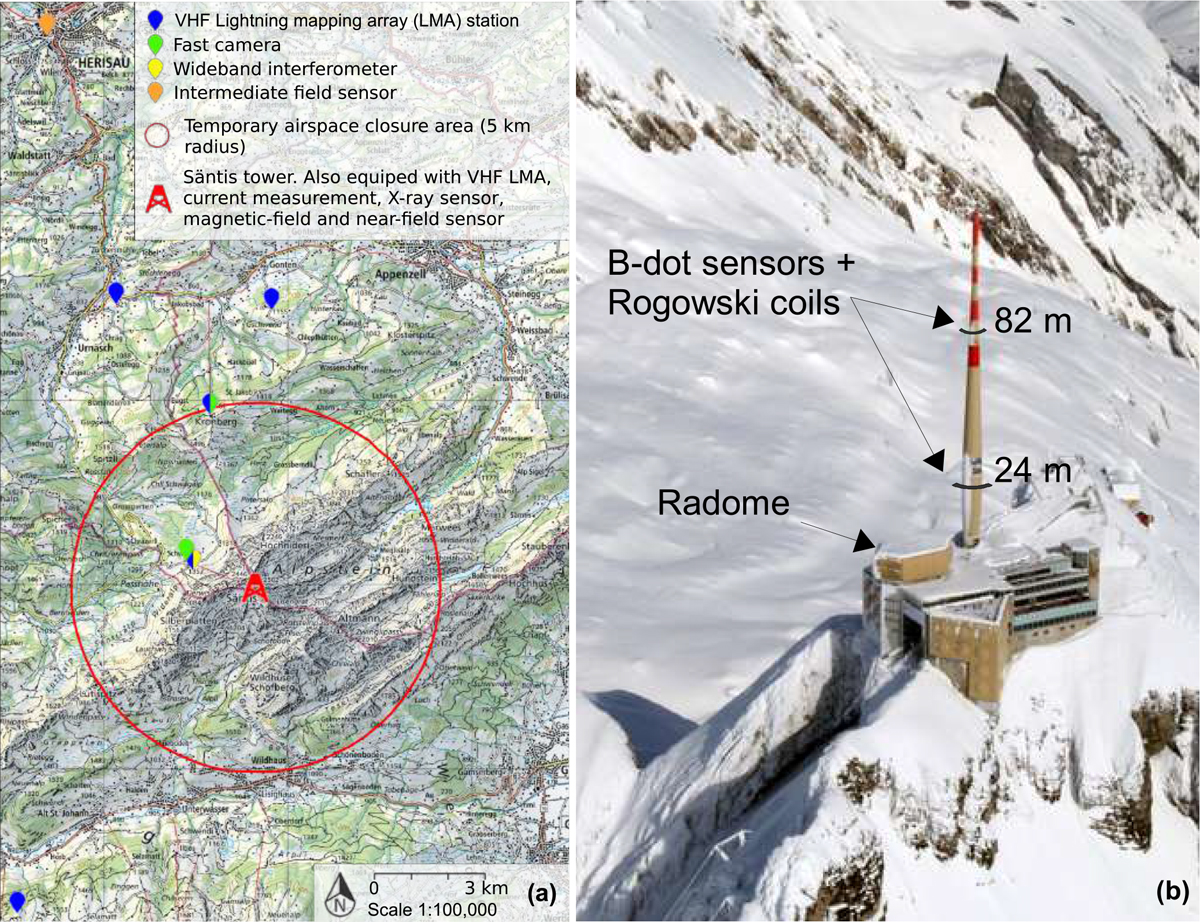
Experimental site: Säntis station. (a) Situation map, including auxiliary instruments and no-fly zone – background map Swisstopo. (b) General view of the station and location of the Rogowski coils and B-dot sensors measuring lightning currents – background image from [61].
Current usage metrics show cumulative count of Article Views (full-text article views including HTML views, PDF and ePub downloads, according to the available data) and Abstracts Views on Vision4Press platform.
Data correspond to usage on the plateform after 2015. The current usage metrics is available 48-96 hours after online publication and is updated daily on week days.
Initial download of the metrics may take a while.