Fig. 4
Download original image
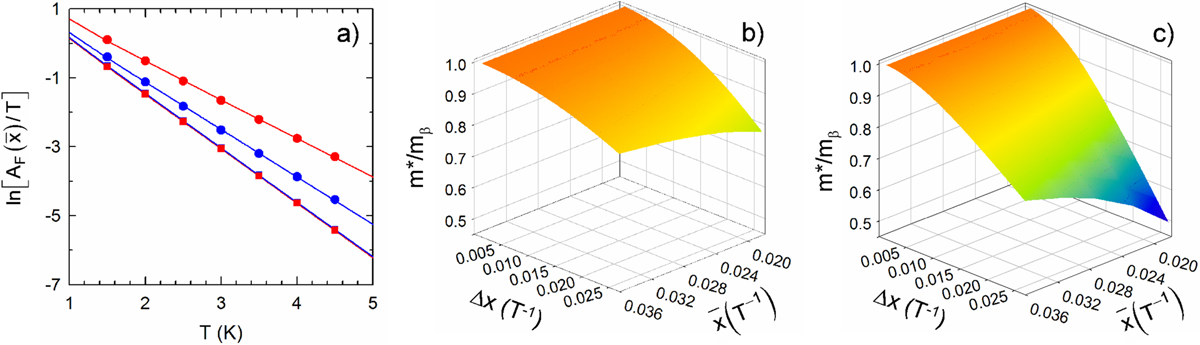
(a) Mass plots relevant to the β component of the organic metal θ-(ET)ZnBr(CHCl), with effective mass mβ = 3.44, deduced from the Fourier analysis for ![]() = 1/32 T, in the temperature range 1.5–4.5 K. Blue and red symbols are data obtained with Blackman and flat windows, respectively. Solid squares and circles are data for Δx = 0.00093 T−1 and 0.0265 T−1, respectively. Solid lines are best fits to the Lifshitz–Kosevich formula. For large Δx, both the Fourier amplitude increases and the slope decreases yielding underestimated effective mass. Such fittings yield data of Figure 4b and c, where the effective mass is plotted versus the inverse field window width (Δx) and mean inverse field value (
= 1/32 T, in the temperature range 1.5–4.5 K. Blue and red symbols are data obtained with Blackman and flat windows, respectively. Solid squares and circles are data for Δx = 0.00093 T−1 and 0.0265 T−1, respectively. Solid lines are best fits to the Lifshitz–Kosevich formula. For large Δx, both the Fourier amplitude increases and the slope decreases yielding underestimated effective mass. Such fittings yield data of Figure 4b and c, where the effective mass is plotted versus the inverse field window width (Δx) and mean inverse field value (![]() ) for (b) Blackman and (c) flat window. At high field (i.e. small
) for (b) Blackman and (c) flat window. At high field (i.e. small ![]() ) and large field window width (Δx), strong underestimation of the effective mass is obtained.
) and large field window width (Δx), strong underestimation of the effective mass is obtained.
Current usage metrics show cumulative count of Article Views (full-text article views including HTML views, PDF and ePub downloads, according to the available data) and Abstracts Views on Vision4Press platform.
Data correspond to usage on the plateform after 2015. The current usage metrics is available 48-96 hours after online publication and is updated daily on week days.
Initial download of the metrics may take a while.